Solid - Liquid Phase Diagrams
liquid & vapor phases. 1 vapor phase. 1 liquid phase. Temperature. 2 liquid phases. A. B. Solid - Liquid Phase Diagrams

Solid - Liquid Phase Diagrams
E N D
Presentation Transcript
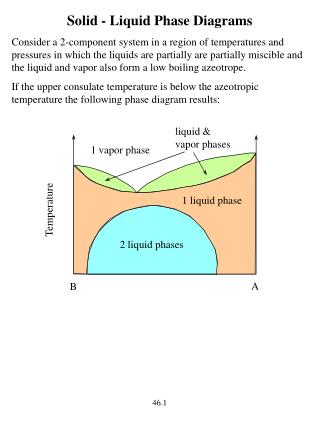
liquid & vapor phases 1 vapor phase 1 liquid phase Temperature 2 liquid phases A B Solid - Liquid Phase Diagrams Consider a 2-component system in a region of temperatures and pressures in which the liquids are partially are partially miscible and the liquid and vapor also form a low boiling azeotrope. If the upper consulate temperature is below the azeotropic temperature the following phase diagram results: 46.1
Temperature A B If, on the other hand, the upper consulate temperature is higher than the temperature of the low boiling azeotrope, the two phases regions grow into each other and we get the following phase diagram: On the above phase diagram describe the phases that are stable or in equilibrium in each region of the diagram? 46.2
g solid phase in equilibrium with melt liquid melt a solid solution of A in B a solid phase in equilibrium with melt g solid solution of B in A Temperature a and g solid phases in equilibirum A B The binary liquid vapor phase diagram that we have just considered, where the upper consulate temperature is higher than the low boiling azeotropic temperature, has a structure that is characteristic of many binary solid liquid phase diagrams: Rules for interpreting binary phase diagrams: 1. A binary phase diagram consists of one phase regions, two phase regions, and horizontal lines of three phase equilibrium. 2. A horizontal line of three phase equilibrium is a boundary for three two phase regions: a. a eutectic line has 2 two phase regions above the line and 1 two phase region below the line. b. a pertectic line has 1 two phase region above the line and 2 two phase regions below the line. 3. A horizontal traverse must alternately encounter one and two phase regions. 46.3
Consider the binary Ag - Mg phase diagram: 1. Starting at the left of the above diagram successively label each of the regions where single solid phases are stable with the Greek letters a, b, g, d, f, and q (you may not need all of these letters). 2. Label the region where the melt exists with an L 3. In each of the regions where two phases are in equilibrium use the appropriate Greek letters to indicate what these phases are. 4. Identify any lines of three phase equilibrium and label these lines as eutectic or peritectic, indicating the phases that are in equilibrium along these lines. 46.4
freezing point depression curve resulting from the dissolving of Si in Au Tom, Si Tom, Au liquid melt pure solid Si in equilibrium with melt Temperature Te a two phase mixture of pure solid Au and pure solid Si pure solid Au in equilibrium with melt Xe Si Au XSi Some solids, Au and Si are an example, are completely immiscible in each other over the entire composition range. Consider the Au - Si phase diagram developed at 1.000 bar total pressure. Note that liquidus curve that defines the composition of the liquid in equilibrium with the solid is also the curve of the depressed freezing point of the pure solid that results from adding a second solid into the melt. What phases are in equilibrium along the eutectic line? In this system are the eutectic temperature and composition fixed or can they vary? 46.5
An equation can be developed to describe the liquidus lines. Consider the equilibrium between pure solid Au and a liquid solution of Si in Au: 1 bar Au (s) ------> Au (liquid Au solution containing Si) At equilibrium the chemical potentials of Au in these two phases are equal: uAu (s) = uAu (soln) We will take the standard state of the solid Au to be pure solid Au and the standard state for the Au in solution to be pure liquid Au: uoAu (s) = uoAu (liq) + R T ln aAu(soln) Rearranging and dividing through by T and then differenting with respect to temperature at constant pressure gives: [ (uoAu (s) / T) / T )]P - [ (uoAu (liq) / T) / T ]P = R [ ( ln aAu(soln) ) / T ]P which using the Gibbs Helmholtz equation: [ (Go / T) / T]P = [ (uo / T) / T ]P = - Ho / T2 can be written: HoAu (liq) - HoAu (s) = D Homelt, Au = R T2 [ ( ln aAu(soln) ) / T ]P where D Homelt, Au is the molar enthalpy of melting of pure Au at standard pressure: 1 bar Au (s) ----------> Au (liq) Tom, Au 46.6
The variables in this equation can be separated and integrated from pure liquid Au, where the melting point is Tom, Au to a liquid Au solution containing dissolved Si with a melting point of Tm: 0ln aAu(soln) d ( ln aAu(soln) ) = Tom, AuTmD Homelt, Au / ( R T2 ) dT Why is the lower limit on the left integral zero? Making the reasonable assumption that D Homelt, Au is not a function of temperature and integrating gives: ln aAu(soln) = - D Homelt, Au / R [ 1 / Tm - 1 / Tom, Au ] If the liquid solution is ideal, then we can write: ln XAu(soln) = ln (1 - XSi(soln) ) = - D Homelt, Au / R [ 1 / Tm - 1 / Tom, Au ] This expression can be solved for to give an equation describing the Au liquidus or Au freezing point depression curve: XSi(soln) = 1 - e - D Homelt, Au / R [ 1 / Tm - 1 / Tom, Au ] Using data in Chemical Rubber Company Handbook of Chemistry and Physics determine the eutectic temperature and composition in the Au - Si system. 46.7
cooling curve liquid melt melt saturated in Si, which begins to precipitate melt cools 1400 oC break 1000 oC Si precipitates from the melt Temperature eutectic halt Te melt saturated in both Si & Au solid Au & Si mixture cools Xmelt XT Xe time XSi Si Au Consider the changes that occur in cooling a Au and Si containing melt that is 50 mole % Si from 1400 oC: Initially the melt just cools. At 1000 oC the melt becomes saturated in Si and pure solid Si just begins to precipitate out of the melt. As the temperature is further lowered more Si precipiates from the melt. What happens to the composition of the melt as this is occurring? At any point in the two phase region the relative amounts of melt and pure solid Si present are given by the lever law: nmelt ( XT - Xe ) = n Si(s) (1 - XT ) 46.8
50.0 grams of melt that is initially 50.0 mole % in Si is cooled to 650 oC, at which point 3.00 grams of Si have precipiated from the solution. What is the composition of the melt at this point in mole percent Si? At the eutectic temperature the melt also becomes saturated in Au and pure solid Au precipiates from the melt along with the Si. The temperature remains fixed (why?) during this eutectic halt, until the melt is exhausted. Once the melt is exhausted further cooling just cools a mixture of pure solid Au and Si of composition, XT. 46.9
The slope of the cooling curve is determined by the heat capacity of the system and the rate of cooling. • Differentiating the heat capacity: • dT = dq / C • with respect to time: • dT/dt = (1 / C) dq/dt • Do systems with higher heat capacities cool faster or slower? • Where only the melt is present this expression can be written: • dT/dt = dq/dt 1 / [ (nAu + nSi) (XAu Cp, Au(l) + XSi Cp, Si(l) ] • When solid Si begins to precipitate, the rate of cooling changes and in fact becomes non-linear (but not noticeably) because: • The relative number of moles of Si in the melt and solid Si is constantly changing as solid Si precipitates from the melt, resulting in a constantly changing heat capacity. • The precipitation of Si from the melt is exothermic, thus changing the rate of heat removal. rate of cooling rate of heat removal (experimentally designed to be constant) 46.10
length of halt (time) Xe 1 XSi 0 The length of the eutectic halt is proportional to the moles of the liquid melt that are present when the eutectic temperature is reached: time of halt = nmeltDHoe / (dq/dt) = ntotal [(1 - XT ) / (1 - Xe )] DHoe / (dq/dt) At what overall composition would you expect to observe the longest halt, at what composition the shortest halt? Plots of the length of the eutectic halt versus overall composition can be used to determine the eutectic composition: 46.11
compound melts congruently 30oC Temperature P = phenol 0.5 T = p-toluidine 1 0 XP The p-toluidine phenol binary solid liquid phase diagram exhibits compound formation between p-toluidine and phenol: liquid melt When a solid that is 50 mole % phenol is heated to 30 oC, the solid melts to form a liquid that is also 50 mole % in phenol. Congruent meltingin which a solid melts to form a liquid of the same composition is indicative of compound formation. Since the compound is 50 mole % phenol, it would have an empirical formula of: T1.0-0.5 P0.5 = T0.5 P0.5 = T1 P1 = TP Label the above regions according to the phases that are stable or in equilibrium in each region. Indicate any eutectic or peritectic lines and the phases in equilibrium along these lines? Note that compound formation divides the more complicated phase diagram into simpler diagrams that resemble phase diagrams associated with simple eutectic behavior. 46.12
compound A melts incongruently to give compound B and a melt that is ~ 30 mole % in Ni 1000 oC Temperature 500 oC B = 0.667 Mg A = 0.333 Ni 1 0 XNi Incongruent meltingin which an unstable compound rather than melting on heating decomposes to give another solid and a liquid of a composition different than the original compound is illustrated in the Mg and Ni binary solid - liquid phase diagram: What are the empirical formulas of compounds A and B? Label the phase diagram according to the phases that are present or are stable? Describe the changes that occur as a melt that is 50 mole % Ni is cooled from 1300 oC to 400 oC. For the above cooling write the reaction that occurs at the peritectic line. What is the limiting reactant? 46.13
The phase diagram for the sulfuric acid water system, which exhibits compound or hydrate formation between sulfuric acid and water, is shown below: What are the empirical formulas of the sulfuric acid water hydrates present in this phase diagram? Which of them melt congruently and which decompose on heating? If you live in a cold climate and allow your car battery acid to reach a level of ~ 85% by weight sulfuric acid, should you be concerned? 46.14
1500 oC 1420 EC 1250 EC Temperature 1160 EC 1000 oC 0.47 0.64 TiO2 MnO wMnO For the TiO2 and MnO binary solid - liquid phase diagram: 1 0 Label all the regions according to the phases present. For any compounds determine: their empirical formulas whether they are stable or unstable the temperatures at which they melt or decompose Label all eutectic and peritectic lines, indicating the phases that are in equilibrium along these lines. Construct a cooling curve for a 45.0 weight % MnO melt that is initially at 1500 oC and cools to 1000 oC (see the red isopleth on the diagram). Describe the changes that occur along this isopleth. 100.0 grams of the melt described above is cooled to 1200 oC, where the composition of the melt is 39.0 weight % MnO. Calculate the grams of all phases present and the grams of TiO2 and MnO that are present in the melt. 46.15
melt and solid solution of Mo & W in equilibrium 3387 oC liquid melt of Mo & W Temperature 2623 oC solid solution of Mo and W W Mo Mo and W are examples of two solids that are completely miscible with each other over the entire composition range: 46.16
Temperature Au Fe Au and Fe exhibit limit miscisbility and an upper consulate temperature that is higher than the solidus temperature, giving rise to the following phase diagram: Describe and label the phases on this phase diagram. Construct a cooling curve for the isopleth shown on the diagram and describe the changes that occur as a melt of this composition is cooled along this curve. Write an equation describing the reaction that occurs at the peritectic. 46.17
Given the following information construct a semi-quantitative binary solid - liquid phase diagram for Al and Co with a mole % Co axis (use decent ruled graph paper to do this problem): • pure Al melts at 658 oC • pure Co melts at 1480 oC • AlCo melts congruently at 1630 oC • Al5Co2 decomposes at 1170 oC to give a liquid that is 24 mole % Co. • Al4Co decomposes at 945 oC to give a liquid that is 19 mole % Co. • At 1375 oC solid solutions that are 84 and 92 mole % in Co are in equilibrium with a melt that is 89 mole % in Co. • At 500 EC a eutectic that is 12 mole % in Co is formed. • An extensive on line collection of binary phase diagrams can be found at: • http://cyberbuzz.gatech.edu/asm_tms/phase_diagrams/ • A good complilation of both binary and ternary (primarily) phase diagrams can be found: • Phase Diagrams for Ceramists, The American Ceramic Society, Westerville, Ohio, Volumes I - XIV. 46.18