Download
1 / 8
90 likes | 174 Vues
Mn(II), Co(II), Ni(II), Pd(II) and Pt(II) complexes containing a tetradentate macrocyclic nitrogen ligand i.e. 1,5,8,12-tetraaza-2,4,9,11-tetramethyl cyclotetraaza-1,4,8,11-tetraene, (L),<br>have been synthesized. The ligand was characterized on the basis of elemental analyses, IR, 1H NMR and EI mass spectral studies while that of the complexes were characterized by elemental analyses, molar conductance, magnetic usceptibility measurements, mass, IR, electronic and ESR spectral studies. On the basis of IR, electronic, and ESR spectral studies, an octahedral geometry has been assigned for the Mn(II), Co(II) and Ni(II) complexes, whereas square planar geometry were found for the Pd(II) and Pt(II) complexes. In vitro the ligand and its complexes were against two pathogenic fungi (i.e., lternaria alternata and Aspergillus niger) to assess their growth inhibiting potential. <br>

E N D
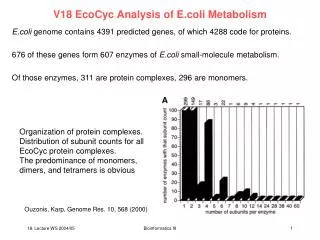
Available on line www.jocpr.com Journal of Chemical and Pharmaceutical Research __________________________________________________ J. Chem. Pharm. Res., 2011, 3(1):56-63 ISSN No: 0975-7384 CODEN(USA): JCPRC5 Tetraaza macrocyclic complexes: Synthesis, spectral and antifungal studies Monika Tyagi1#, Sulekh Chandra1* and Sunil Kumar Choudhary2 1Department of Chemistry, Zakir Husain College (University of Delhi) J.L.N. Marg, New Delhi, India 2Department of Applied Chemistry, GPMCE(GGSIPU), G.T. Karnal Road, Delhi, India ______________________________________________________________________________ ABSTRACT Mn(II), Co(II), Ni(II), Pd(II) and Pt(II) complexes containing a tetradentate macrocyclic nitrogen ligand i.e. 1,5,8,12-tetraaza-2,4,9,11-tetramethyl cyclotetraaza-1,4,8,11-tetraene, (L), have been synthesized. The ligand was characterized on the basis of elemental analyses, IR, 1H NMR and EI mass spectral studies while that of the complexes were characterized by elemental analyses, molar conductance, magnetic susceptibility measurements, mass, IR, electronic and ESR spectral studies. On the basis of IR, electronic, and ESR spectral studies, an octahedral geometry has been assigned for the Mn(II), Co(II) and Ni(II) complexes, whereas square planar geometry were found for the Pd(II) and Pt(II) complexes. In vitro the ligand and its complexes were against two pathogenic fungi (i.e., Alternaria alternata and Aspergillus niger) to assess their growth inhibiting potential. Keywords : Tetradentate macrocycle, Transition metal complexes, Antifungal screening. ________________________________________________________________________ INTRODUCTION The tetraaza macrocyclic ligand and their metal complexes have attracted growing interest among the coordination and bioinorganic chemistry [1]. Macrocyclic Schiff base ligands have received special attention because of their mixed soft-hard donor character, versalite coordination behaviour [2-4] and their pharmacological properties, i.e. antifungal , antibacterial, anticancerous, antitumor [5-8]. Transition metal macrocyclic complexes have received much attention as a active part of metalloenzymes[9] as biomimic model compounds [10] due to their resemblance with natural proteins like hemerythrin and enzymes. Transition metal complexes have received much attention in the oxidation and epoxidation processes [11-13]. Structural factors, such as ligand rigidity, the type of donor atoms and their disposition have shown to play 56
Sulekh Chandraet al J. Chem. Pharm. Res., 2011, 3(1):56-63 ______________________________________________________________________________ significant roles to determine the binding features of macrocyclic toward metal ion [14,15] In view of the above discussion , in this paper we report the synthesis, spectral and biological investigation of Mn(II), Co(II), Ni(II), Pd(II) and Pt(II) complexes of macrocyclic ligand derived from acetyl acetone and ethylene diamine (Figure 1). CH3COCH2COCH3 + 2 2 NH2CH2CH2NH2 few drops of conc. HCl Reflux for 8 hrs at 80oC C C H2 H2 H3 C CH3 C N N C H2 C CH2 C N N C H3 C CH3 C C H2 H2 Figure: 1 Synthesis of ligand EXPERIMENTAL SECTION Materials All the chemicals used were of Anala R grade and procured from Sigma-Aldrich and Fluka. Metal salts were purchased from E. Merck and were used as received. All solvents used were of standard / spectroscopic grade. Synthesis of ligand A hot ethanolic solution (20 mL) of acetyl acetone (2.0 g, 0.02 mol) and an ethanolic solution (20 mL) of ethylene diamine (1.2 g, 0.02 mol) were mixed with constant stirring. The mixture was refluxed at 800C (±5) for 8 hrs in the presence of few drops of conc. HCl (pH~3-4). Upon cooling a cream coloured compound precipitated. It was filtered, washed with cold EtOH and dried under vaccum over P4O10. Elemental analysis found % C 67.69, H 9.63, N 22.51 calculated for C14H24N4 (molecular mass 248 amu) % C 67.74, H 9.67, N 22.58. Synthesis of metal complexes Hot ethanolic solution (20 ml) of the corresponding metal salts (0.001 mol) and a hot ethanolic solution (20 ml) of the respective ligand (0.001 mol) were mixed together with constant stirring. The reaction mixture was refluxed for 6 hrs at 75-800C. On cooling a coloured complex was formed in each case. The complex was filtered, washed with cold EtOH and dried under vacuum over P4O10. 57
Sulekh Chandraet al J. Chem. Pharm. Res., 2011, 3(1):56-63 ______________________________________________________________________________ Physical measurements C, H, and N were analyzed on a Carlo-Erba 1106 elemental analyzer. Molar conductance was measured on the ELICO (CM82T) conductivity bridge. Magnetic susceptibility was measured at room temperature on a Gouy balance using CuSO4.5H2O as calibrant. 1H NMR spectra was recorded at room temperature on a Bruker Avance DPX-300 spectrometer using DMSO-d6 as a solvent. IR spectra (KBr) were recorded on FTIR spectrum BX-II spectrophotometer. The electronic spectra were recorded in DMSO on a Shimadzu UV mini-1240 spectrophotometer. ESR spectra of the complexes were recorded as polycrystalline samples and in a DMSO solution at liquid nitrogen temperature (LNT)for Co(II) and room temperature (RT) for the Mn(II) complexes on an E4-EPR spectrometer using DPPH as a g- marker. RESULTS AND DISCUSSION The formation of the complexes can be represented by the following reaction: where M= Mn(II), Co(II), Ni(II), Pd(II) and Pt(II). On the basis of elemental analysis, the complexes were assigned to possess the composition as shown in Table 1. The Mn(II), Co(II)and Ni(II) complexes are non-electrolytes with conductance values of 08-15 Ω-1cm2mol-1. However, the molar conductance data of the Pd(II) and Pt(III) complexes lies in the range 208-210 Ω-1cm2mol-1 indicating 1: 2 electrolytic nature. Thus these complexes may be formulated as [M(L)]Cl2 and [M’(L)]Cl2 [where M= Mn(II), Co(II), Ni(II) and M’= Pd(II) and Pt(II)]. Table 1: Elemental analysis data for ligand (L) and its metal complexes Compounds Colour Yield (%) (0C) C L (C14H24N4) (67.74) [Mn(L)Cl2] MnC14H24N4Cl2 (44.92) [Co(L)Cl2] CoC14H24N4Cl2 (44.45) [Ni(L)Cl2] NiC14H24N4Cl2 (44.45) [Pd(L)]Cl2 PdC14H24N4Cl2 (67.74) [Pt(L)]Cl2 PtC14H24N4Cl2 (32.68) Mass Spectrum The EI mass mass spectrum of ligand confirm the proposed formula by showing a peak at 248 amu corresponding to the macrocyclic moiety [(C14H24N4)]. The spectrum also shows a series of peaks, i.e., 15, 26, 38, 42, 66,108, 150, 203, 218 and 233 amu, corresponding to various fragments. M.p. Elemental analysis found (calcd.)(%) H 67.69 9.63 (9.67) 44.87 6.37 (6.42) 44.40 6.28 (6.35) >300 44.42 6.39 (6.35) 270 67.70 5.71 (5.65) 278 32.62 4.60 (4.67) Molar conductance (Ω-1cm2mole-1) -- N 22.51 (22.58) 14.91 (14.97) 14.78 (14.81) 14.84 (14.81) 13.24 (13.18) 10.92 (10.89) M -- Cream 70 244 White 62 260 22.25 (22.18) 15.56 (15.61) 15.54 (15.61) 42.80 (42.74) 37.99 (37.94) 12 Pink 72 268 08 Green 75 15 Brown 66 208 Yellow 69 210 58
Sulekh Chandraet al J. Chem. Pharm. Res., 2011, 3(1):56-63 ______________________________________________________________________________ 1H NMR Spectrum The 1H NMR spectrum of the ligand does not give any signal corresponding to the primary amine protons. The spectrum exhibits the three singlets, one at ca. δ 2.30 ppm (S, 12H, 4CH3), second at ca. δ 3.64 ppm (S, 4H, 2CH2) and third at ca. δ 4.75 ppm (S, 8H, 4CH2). These singals indicate the presence of three types of the different protons in the ligand [16]. IR Spectra The Important IR bands and their assignments of ligand (L) and its complexes are listed in Table 2. The IR spectrum of the ligand does not exhibit any band corresponding to primary diamine or free keto group [17]. This suggests the complete condensation of the amino group with the keto group [18]. The spectrum shows a very strong band at 1600 cm–1 which is attributed to the (C=N) stretching vibration. On complexation the position of (C=N) band is shifted towards the lower side. This indicates that the nitrogen atoms of azomethine groups are coordinated to the metal ions [19]. The bands at 425-452 and 295-320 cm-1 can be assigned to ν(M-N) and ν(M- Cl), respectively. Table 2: Infrared absorption frequencies (cm-1) of ligand and its metal complexes Compound ν (C=N) L 1600 [Mn(L)Cl2] 1582 [Co(L)Cl2] 1575 [Ni(L)Cl2] 1565 [Pd(L)]Cl2 1570 [Pt(L)]Cl2 1568 Magnetic Moments and Electronic Spectra Manganese(II) Complex This complex shows magnetic moment 5.86 B.M. (Table 3) corresponding to five unpaired electrons .The electronic spectrum of the Mn(II) complex displays weak absorption bands at 18181 cm-1, 23200 cm-1, 29500 cm-1 and 33003 cm-1 . These bands can be assigned to the transitions : 6A1g→4T1g (4G), 6A1g→4Eg, 4A1g4 (4G) (10B + 5C), 6A1g→4Eg (4D) (17B + 5C), and 6A1g→4T1g4 (4P) (7B + 7C), respectively [20]. The complex may possess an octahedral geometry. Cobalt(II) Complex Co(II) complex shows magnetic moment 4.87 B.M. corresponding to three unpaired electrons. The electronic spectrum of the cobalt(II) complex exhibits absorption at 9652 cm-1, 14727 cm-1 and 19723 cm–1 . These bands may be assigned to the transitions : 4T1g(F)→4T2g(F) (ν1), 4T1g→ 4A2g (ν2), and 4T1g(F)→4T2g(P) (ν3), respectively. The position of these bands suggests an octahedral environment around the Co(II) ion [21]. Nickel(II) Complex Ni(II) complex shows magnetic moment 2.92 B.M. at room temperature corresponding to two unpaired electrons. The electronic spectrum exhibits three absorption bands at 10504 cm-1, 14814 cm-1 and 27027 cm–1 . These bands may be assigned to the transitions: 3A2g(F) →3T2g Assignments ν(M-N) ν(M-Cl) - - 445 425 437 298 295 320 315 308 452 430 59
Sulekh Chandraet al J. Chem. Pharm. Res., 2011, 3(1):56-63 ______________________________________________________________________________ (F) (ν1), 3A2g(F) → T1g (F) (ν2), and 3A2g (F) →3T1g (P) (ν3), respectively [22]. Position of these bands indicates an octahedral geometry around the Ni(II) ion. Palladium(II) and Platinum(II) Complexes These complexes are diamagnetic as expected for square planar d8 system. The electronic spectra of Pd(II) and Pt(II) complexes show three d-d spin allowed transitions at 18867- 21052 cm-1, 22321-24271 cm-1 and 25510-28571 cm-1. These bands are attributed to 1A1g→1A2g (ν1), 1A1g→ 1B1g (ν2) and 1A1g→1Eg (ν3) transitions, respectively. The electronic spectra of these complexes indicate the square planar geometry around the Pd(II) and Pt(II) ion [23]. Electronic Paramagnetic Spectra The EPR spectrum of the Mn(II) complex was recorded as polycrystalline sample and in DMSO solution. The polycrystalline sample give one broad isotropic signal centered at approximately the free electron g-value (g0 = 2.0023). The broadening of the spectrum probably is due to spin relaxation.24 In DMSO solution the complex gives an EPR spectrum containing six lines arising due to hyperfine interaction between the unpaired electrons with 55Mn nucleus (l =5/2 ). The nuclear magnetic quantum number, M1 corresponding to the lines are -5/2, -3/2, -1/2, +3/2, +5/2 from low to high field. The EPR spectrum of the cobalt(II) complex was recorded as polycrystalline sample and in the DMSO solution at liquid nitrogen temperature (LNT). The g- values (Table 3) were found to be almost same in both the cases in polycrystalline sample, as well as in the solution. The large deviation in the gvalues from the free electron value (g = 2.0023) is due to large angular momentum contribution . Table 3: Electronic spectral bands (cm-1) and EPR spectral data of complexes Compound µeff (B.M.) λmax (cm-1) g|| g⊥giso [Mn(L)Cl2] 5.86 18181, 23200, 29500, 33003 - - 2.02 [Co(L)Cl2] 4.87 9652, 14727, 19723 3.55 3.22 3.36 [Ni(L)Cl2] 2.92 10504, 14814, 27027 - - - [Pd(L)]Cl2 Diamagnetic 21052, 22321, 25510 - - - [Pt(L)]Cl2 Diamagnetic 18867, 24271, 28571 - - - On the basis of spectral studies, the following structure may be suggested for the complexes (Figure. 2 (a), (b) ). Data as polycrys-talline sample Data in DMSO solution g|| g⊥ A°/giso - - 120 3.85 3.59 3.68 - - - - - - - - - C C H2 H2 H3 C CH3 Cl C N N C M H2 C CH2 C N N C Cl H3 C CH3 C C H2 H2 (a) M= Mn(II), Co(II) , Ni(II) 60
Sulekh Chandraet al J. Chem. Pharm. Res., 2011, 3(1):56-63 ______________________________________________________________________________ C C H2 H2 H3 C CH3 C N N C M' Cl2 H2 C CH2 C N N C H3 C CH3 C C H2 H2 ( b) M’= Pd(II) and Pt(II)] Figure: 2. Suggested structure of the complexes Antifungal Screening In vitro antifungal activity of the ligand and its complexes were tested using food poison technique. 25,26 Alternaria alternata and Aspergillus niger were used as test fungi. Test compounds were mixed with Potato Dextrose Agar ( PDA) medium and the solution in distilled water were prepared of 500, 250 and 125 ppm concentrations. These were autoclaved at 1000C and then cooled adequately. The medium was dispensed into sterilized petriplates. When the medium in the petriplates was solidified, a mycelial discs of 0.5 cm in diameter cut from the periphery of the 7 days old culture and it was aseptically inoculated upside down in the centre of the petriplates. These treated petriplates were incubated at 26±1°C until fungal growth in the control petriplates was almost complete. Radial growth of colonies was measured at two points along the diameter of the plate and average of these two readings was taken as the diameter of the fungal colony. The % inhibition was measured according to the formula: (C − T) × 100 / C, where C and T are the radial diameter of the colony in control and treatment, respectively. The results have shown that complexes used for the experiment exhibited noble activities than the ligand towards the inhibition of test fungi under the test conditions. MIC (Minimum Inhibitory Concentration) of test compounds against both the fungus was 500 ppm and have shown 100% inhibition (Table 4). The compounds have shown fungal inhibition in the following order : Acetyl acetone< Ethylene diamine <L < Mn < Ni < Co < Pd< Pt. Table 4: Fungicidal screening data of the ligand and complexes Compound Alternaria alternata 500 250 Acetyl acetone 100 50 Ethylene diamine 100 56 L 100 65 [Mn(L)Cl2] 100 69 [Co(L)Cl2] 100 78 [Ni(L)Cl2] 100 73 [Pd(L)]Cl2 100 82 [Pt(L)]Cl2 100 89 Aspergillus niger 250 47 50 59 62 81 70 86 92 125 30 35 46 50 63 57 69 71 500 100 100 100 100 100 100 100 100 125 25 36 42 49 67 54 65 77 61
Sulekh Chandraet al J. Chem. Pharm. Res., 2011, 3(1):56-63 ______________________________________________________________________________ CONCLUSION The proposed study revealed an octahedral geometry for the Mn(II), Co(II), and Ni(II) complexes whereas square planar geometry for the Pd(II) and Pt(II) complexes. The ligand acts as a tetradentate manner coordinating through four nitrogens of azomethine groups in N N N N fashion. On the otherhand, the fungicidal data reveals that the complexes are superior than the free ligand. It has also been proposed that concentration plays a vital role in increasing the degree of inhibition; as the concentration increases , the activity increases. Acknowledgement Authors are thankful to the DRDO (New Delhi) for financial support. REFERENCES [1] E. Tas; A. Kilic; M. Durgun; L. Kupecik; I. Yilmaz ; S. Asslam. Specrochim Acta A, 2010, 75, 811. [2] P. Comba; M. Kerscher; Y.D. Lampeka; L.L Lotzbeyer; H. Prizkow ; L.V. Tsymbal. Inorg. Chem.,2003, 42, 3387. [3]G. Puhilbhai; S. Vasudhevan; S. Kutti Rani; G. Rajago. Spectrochim. Acta A, 2009, 72, 687. [4]P. Sengupta; R. Dinda; S. Ghosh; W.S. Sheldrick. Polyhedron,2003, 22, 477. [5] S. Chandra; Sangeetika. Spectrochim. Acta A,2004, 60, 147 . [6]S. Chandra; K. Gupta. Transition Met. Chem.,2002, 27, 196. [7] S. Chandra; L.K. Gupta. Spectrochim. Acta A, 2005, 61, 2169. [8]U. Hiiseyin; H. Zeliha. Spectrochim. Acta A ,2010, 75, 782. [9]M. Canadas; E. Lopez-Torres; A.M. Arias; M.A. Mandioca; M.T. Sevilla. Polyhedron, 2000, 19, 2059 . [10]A. Chaudhary; S. Dave; R. Swaroop; R.V. Singh. J. Indian Chem. Soc.,2002, 79, 37. [11]S. Chandra; L.K. Gupta; K. Gupta. J. Indian Chem. Soc.,2004, 81, 833 . [12] Y. Wei; H. Guo; C. Wang. Spectrochim. Acta A ,2006, 31, 611 . [13] M. Salavati-Nisari; M. Frarzaneh; M. Ghandhi. J. Mol. Catal. A,Chem.,2001, 175, 105 . [14]M. Salavati-Nisari. J. Mol. Catal. A, Chem.,2005, 229, 159 . [15] S. Chandra; L.K. Gupta. Spectrochim. Acta A, 2005, 61, 1181. [16]S. Chandra; L.K. Gupta; D. Jain. Spectrochim. Acta A,2004, 60, 2411 . [17] John R. Dyer, Application of Absorptions Spectroscopy of Organic Compounds, Sixth Ed., Georgia Institute of Technology , 1987. [18]S. Chandra; L.K. Gupta. Spectrochim. Acta A, 2004, 60, 3079 . [19]P.S. Kalsi. Spectroscopy of Organic Compounds, New Delhi (India): New Age International (P) Ltd. 1999. [20]C.R.K. Rao; P.S. Zacharias. Polyhedron, 1997, 16, 1201 . [21] S. Chandra; M. Tyagi. J. Indian Chem. Soc., 2008, 85, 42 . [22]S. Chandra; A. Gautam ; M. Tyagi. Transition Met. Chem.,2007, 32, 1079. [23]S. Chandra; A. Gautam; M. Tyagi. Russ. J. Coord. Chem.,2009, 35, 25. [24]S. Chandra; M. Tyagi. J. Serb. Chem. Soc.,2008, 73, 727 . [25]S. Chandra; S. Raizada; M. Tyagi; A. Gautam. Bioinorg. Chem. Appl., 2007 2007, 1. Article ID 51483. 62
Sulekh Chandraet al J. Chem. Pharm. Res., 2011, 3(1):56-63 ______________________________________________________________________________ [26]S. Chandra; S. Raizada; M. Tyagi ; P.K. Sharma. Spectrochim. Acta A,2008, 69,816. 63