Download
1 / 8
80 likes | 104 Vues
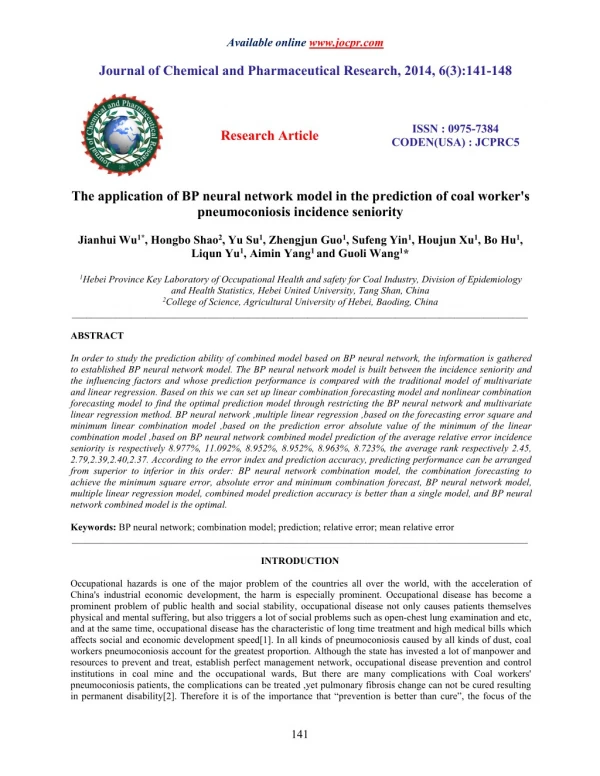
In order to study the prediction ability of combined model based on BP neural network, the information is gathered<br>to established BP neural network model. The BP neural network model is built between the incidence seniority and<br>the influencing factors and whose prediction performance is compared with the traditional model of multivariate<br>and linear regression. Based on this we can set up linear combination forecasting model and nonlinear combination<br>forecasting model to find the optimal prediction model through restricting the BP neural network and multivariate<br>linear regression method. BP neural network ,multiple linear regression ,based on the forecasting error square and<br>minimum linear combination model ,based on the prediction error absolute value of the minimum of the linear<br>combination model ,based on BP neural network combined model prediction of the average relative error incidence<br>seniority is respectively 8.977%, 11.092%, 8.952%, 8.952%, 8.963%, 8.723%, the average rank respectively 2.45,<br>2.79,2.39,2.40,2.37. According to the error index and prediction accuracy, predicting performance can be arranged<br>from superior to inferior in this order: BP neural network combination model, the combination forecasting to<br>achieve the minimum square error, absolute error and minimum combination forecast, BP neural network model,<br>multiple linear regression model, combined model prediction accuracy is better than a single model, and BP neural<br>network combined model is the optimal.

E N D
Available online www.jocpr.com Journal of Chemical and Pharmaceutical Research, 2014, 6(3):141-148 ISSN : 0975-7384 CODEN(USA) : JCPRC5 Research Article The application of BP neural network model in the prediction of coal worker's pneumoconiosis incidence seniority Jianhui Wu1*, Hongbo Shao2, Yu Su1, Zhengjun Guo1, Sufeng Yin1, Houjun Xu1, Bo Hu1, Liqun Yu1, Aimin Yang1and Guoli Wang1* 1Hebei Province Key Laboratory of Occupational Health and safety for Coal Industry, Division of Epidemiology and Health Statistics, Hebei United University, Tang Shan, China 2College of Science, Agricultural University of Hebei, Baoding, China _____________________________________________________________________________________________ ABSTRACT In order to study the prediction ability of combined model based on BP neural network, the information is gathered to established BP neural network model. The BP neural network model is built between the incidence seniority and the influencing factors and whose prediction performance is compared with the traditional model of multivariate and linear regression. Based on this we can set up linear combination forecasting model and nonlinear combination forecasting model to find the optimal prediction model through restricting the BP neural network and multivariate linear regression method. BP neural network ,multiple linear regression ,based on the forecasting error square and minimum linear combination model ,based on the prediction error absolute value of the minimum of the linear combination model ,based on BP neural network combined model prediction of the average relative error incidence seniority is respectively 8.977%, 11.092%, 8.952%, 8.952%, 8.963%, 8.723%, the average rank respectively 2.45, 2.79,2.39,2.40,2.37. According to the error index and prediction accuracy, predicting performance can be arranged from superior to inferior in this order: BP neural network combination model, the combination forecasting to achieve the minimum square error, absolute error and minimum combination forecast, BP neural network model, multiple linear regression model, combined model prediction accuracy is better than a single model, and BP neural network combined model is the optimal. Keywords: BP neural network; combination model; prediction; relative error; mean relative error _____________________________________________________________________________________________ INTRODUCTION Occupational hazards is one of the major problem of the countries all over the world, with the acceleration of China's industrial economic development, the harm is especially prominent. Occupational disease has become a prominent problem of public health and social stability, occupational disease not only causes patients themselves physical and mental suffering, but also triggers a lot of social problems such as open-chest lung examination and etc, and at the same time, occupational disease has the characteristic of long time treatment and high medical bills which affects social and economic development speed[1]. In all kinds of pneumoconiosis caused by all kinds of dust, coal workers pneumoconiosis account for the greatest proportion. Although the state has invested a lot of manpower and resources to prevent and treat, establish perfect management network, occupational disease prevention and control institutions in coal mine and the occupational wards, But there are many complications with Coal workers' pneumoconiosis patients, the complications can be treated ,yet pulmonary fibrosis change can not be cured resulting in permanent disability[2]. Therefore it is of the importance that “prevention is better than cure”, the focus of the 141
Jianhui Wu et al ______________________________________________________________________________ J. Chem. Pharm. Res., 2014, 6(3):141-148 disease control should be paid the following aspects: predicting accurately the incidence of coal workers' pneumoconiosis in advance, and then coming up with strategies of prevention and control, finally minimizing damage[3]. At present, pneumoconiosis researches mostly focused on the analysis of the incidence survey, and used the traditional single forecasting model to make the statistical prediction for groups of indicators ,for example disease incidence. In terms of forecasting method, there are respective applicable conditions and range of applications in establishment and application of the traditional models, and prediction accuracy is not high[4]. In term of predictor, due to the incidence of pneumoconiosis is a complex process influenced by multiple factors (Social factors such as genetic factors, lifestyle, health status, and other individual factors, environmental factors operating environment, health intervention)[5], Statistical indicators of the group the current study selected can only be used to estimate the population situation, yet it is difficult for the individual to make accurate statistical inference, furthermore, the predictive researches is few that can be used to Forecast as an indicator for the more practical significance of individual incidence of seniority. Therefore, in order to achieve pneumoconiosis higher prediction precision, Forecast goal individualized, this subject adopts BP neural network and combination model for coal mine workers on the length of individual prediction, and comparative analysis of model prediction accuracy and performance[6]. BP NEURAL NETWORK AND THE COMBINED MODEL INTRODUCTION The BP neural network model BP neural network is one of multilayer perceptron comprise the input layer, hidden layer and output layer .The learning process includes forward propagation of the signals and the back propagation of errors. In the forward propagation, input information are sent from input layer to output layer after dealt with by implicit layer. If the results of output layer bigger than expected error, the propagation will turn to the second stage ,The error signal is propagated inversely to input layer step by step along the original connection path, by modifying the Connection weights between the nodes of every layer ,repeatedly adjusting network parameters, errors is allocated to all units of each layer, eventually making error signal minimality. "reverse push" learning algorithm, the network structure Combined Model Combined model is a predictive model that is created with several kinds of certain single model whose weight is determined by the influencing degree to the results ,and the sum of each weight is 1[11].The principle of this method is that: assuming a prediction problem, there are m single forecasting method for a forecast object, the predictive value is ki f by using the K ( k less than or equal to m ) method for the I object predicting, m w 1,Using this m predictive values constitute a final forecasting result which is each single model w k , i weight W w , w , , w 1 2 m k k 1 is for w the I prediction x f of the object, if it satisfies f w f w f w f , if w i 1 i 2 i m i , The combination forecasting is a linear combination forecasting, If the combined i f f f g , , , 2 1 , G is a nonlinear function, The combination forecasting is a nonlinear combination forecasting, This is the basic idea of combination forecasting[7]. f x x w i 1 1 i 2 2 i m mi prediction value satisfies i Model 3 the liner combined prediction mode based on the minimum Prediction error sum of squares Suppose the index order for the same prediction object is to predict. suppose the predicted value of the ith object from the kth prediction method is , 2 , 1 xi , i , n , and there have m forecasting methods ki x , and w , e w x x w it i ki , is its prediction error. suppose the weighting coefficient of the m monomers prediction method is respectively. In order to achieve unbiasedness prediction for the combination model, its weighting coefficient should be satisfied with m , , 2 , 1 , 1 1 1 2 m w k m (1) k k if is f w x w x w x Suppose the combined prediction value of i 1 1 i 2 2 i m mi 142
Jianhui Wu et al ______________________________________________________________________________ J. Chem. Pharm. Res., 2014, 6(3):141-148 m e y f w e (2) i i i k ki k 1 Suppose the prediction error of the squares sum of the combined model is 1 1 1 1 Q , its calculation formula is: 1 m n m m 2 Q e w e w e (3) 1 i k ki j ji k i k j From the upper we could conclude, account of the minimum prediction Sum of Squares of the Linear combination forecasting model could be showed: m w 1 n m m min Q w e w e 1 k ki j ji (4) i 1 k 1 j 1 k k 1 In the practical application,iff there is any negative weighted coefficient,The practical significance is not clear frequently and difficult to explain.so it need to add a Non-negative constraints conditions,so it could be expression as the following model: i k j 1 1 1 n m m min Q w e w e 1 k ki j ji (5) m k w w 1 , 0 k , 2 , 1 , m k k 1 This model with unique solution which is the Secondary convex programming problem in the Non-Linear Programming could be translation to matrix form. Model 4 the Linear combination forecasting model based on the sum of absolute value of the prediction error m is the weighting ie is the prediction error of the i object for the combination forecasting, so it has e is ,and e y f w e i i i k ki ki k 1 , w , w , w the prediction error of the i object when use individual prediction method of k, coefficient of the m individual prediction method respectively,and it satisfy with m , , 2 , 1 , 0 , 1 i 1 sum of absolute value of the prediction error. 1 2 m w w k m .Suppose he sum of absolute value of the prediction error of the combination k k k 1 n n m i 1 Q e w e forecasting is Q .and we have , the Linear combination forecasting model based on the 2 i k ki 2 k 1 Model 5 the combination forecasting model based on BP neural network Donaldson and Kamstra come up with the method to use artificial neural network to solve the Nonlinear Combination Forecasting Model and obtain good effect.tis method had been recognized and application. The principle of the Structure and steps of the combination forecasting model based on BP neural network are similar to single BP neural network model.the different is that of the single model’s Network input is the predictive value ) , , 2 , 1 ; , . 2 , 1 ( n i m k fki ,but the output network is still the true value mapping between predictive value and true value from the flexibility network structure and Strong nonlinear mapping ability of the BP neural network. adjustment parameter and achieve the optimal fitting and prediction between BP neural network and Multiple linear regression from adjustment parameter .the wight of each single iy to achieve the relational 143
Jianhui Wu et al ______________________________________________________________________________ J. Chem. Pharm. Res., 2014, 6(3):141-148 model among the combination forecast were achieved by network studying and training .The principle of the steps and parameter setting is similar to single BP neural network[8]. The evaluation index of the model predictive effect Use the relative error as the performance index of the model to analyze the prediction results、judge the feasibility of the forecast method and compares the estimated performance among the forecast method. ①Relative error,is the ratio between the absolute value of the prediction error and the real value.the formula is : e RE ) , , 2 , 1 ( n i i (6) 100 % y i ②Mean relative error,is the mean of relative error the formula is : n i y n e 1 , 2 , 1 ( i , n ) MRE 100 % (7) i i 1 THE PREDICTIVE ANALYTICS ON THE WORK YEAR OF COALWORKER PNEUMOCONIOSIS The source of data The object of study were coal worker pneumoconiosis from a Vinacomin since 1998.The date were root in a Occupational disease prevention, include the Occupational disease declare table、 the diagnose of occupational disease、The health examination registration forms and etc.There were 599 effective samples, they were strictly according to the diagnostic criteria to coal worker pneumoconiosis and included and excluded rules on the object of study. The selection of influence factor ①type of work:could reflect the nature and density of the exposure dust. ②exposure time: reflect the accumulation exposure dust time when coal worker pneumoconiosis wase diagnosed. ③the kinds of mine:were mainly reflected the geology and environmental deviation in different mine,and the difference about the nature of the duck、density、and Protective Measures on the same working space in different mine. ④date of birth 、 initial dust exposure years 、 initial dust exposure age:reflect the impersonality survival environment、work environment、physical condition ect. This text select type of work、exposure time、the kinds of mine、date of birth、initial dust exposure years、initial dust exposure age as the analyze factors which were reported in the literature and determined had influence for coal worker pneumoconiosis’s length of service. Variable classification and assignment The type of work were divided into simple tunnelling worker 、main tunnelling worker 、simple coal digger、main coal digger 、 mixture worker and backman according to occupational history of the coal worker pneumoconiosis.The birth of date and initial dust exposure years were successive types, so in order to convenience statistic analysis, we went recode them with classified variables.On the end, there were 599 effective samples in all. Analysis result To make the number one to six in the table 1 as input variables,and the output variable is the length of service.and use the date of training set and test set to set up the composition of nonlinear BP neural network model and the linear multiple regression model,last,use the date of simulation to forecast, the predicted value of simulation set of BP neural network model and the Linear multiple regression model as the independent variable, the dependent variable is the true value of the length of service to set up the Linear combination model based on the minimum sum of squared errors.the Linear combination model based on minimum sum of nonlinear BP neural network model to predict the length of service for the date of simulation set. And analyze the prediction accuracy. absolute squared errors and the 144
Jianhui Wu et al ______________________________________________________________________________ J. Chem. Pharm. Res., 2014, 6(3):141-148 Descriptive analysis of date To divide the variables into groups, one group is classified variable based on category, the other successive type of years variable was grouped by five or ten years.see table 2.the dependent variable is the length of service, the number is 599 patients totally, the mean is 37.800 10.437,the minium value is six year, and the maximum value is sixty nine years. Simple heading driver 、 main heading driver 、 simple coal digger 、 main coal digger 、 mixture worker and backman Parameter determination and set up model 1 BP neural network We should use fitting effect 、prediction accuracy、the difficult of training、and time to judge the stand or fall for BP BP neural network.we need to consider the following content for the design of BP BP neural network:the number of plies of the network;the number of neuron for each level;the activation function for neuron;the initial value about weight and deviation for the network;the control for study rate and error;the overfitting generated on the training process;the network is easy to sink into local minimum then can’t achieve global optimum[9]. We adopt BP BP neural network base on SPSS18.0 to select variables、normalized processing、the subregion for date set、 define the architecture、training、checkout and simulation depend on this upon selection principle. The built BP neural network model and parameter: according the independent set and the automatic commissioning of software system to build the optimizing BP neural network model, the major parameter was showed in table 1. Table 1: The major parameter of the BP neural network model structural parameters of the net hidden layers :1 the number of hidden layer neurons:9 the number of input layer neurons:6 the number of output layer neurons:1 The activation function of input layers:Sigmoid The activation function of output layers:Sigmoid Training parameters of the net training algorithm:gradient descent the iterations untile stop training:13 Rate of study:0.1 Performance function:SSE Training set when stop train SSE=0.907 Test set when stop train SSE=0.255 Accuracy test and the evaluation for the performance model: selecting the output and true value to make scatter diagram, they have linear trend distribution and have a slope of 45°besides very few splashes. The Tropic fitting and parameter compare between the output value of training set and The simulation set and the true value.There has not statistically significant between predict value and true value when made paired-sample t test for the simulation set of the duration from dust exposure ,(t=-0.273,P=0.785>0.05).The MRE between true value and the forecast result of the test set and the simulation set is 7.143% and 9.043%,it show that the fitting and extrapolation performance of the model is well and the forecast result is reliable. Table2: The comparison between the result from the test fitting and the predict result from the simulation set R2 R2adj dataset R MRE%) Test set Simulation set 0.936 0.928 Multiple linear regressions 0.876 0.860 0.875 0.859 7.442 9.042 2 We bring the assembled date from training samples and checkout samples as test set into SPSS18.0, the dependent variable is the length of service(y)and the independent variable were the type of work( 1 x ), the kind of mine( 6x ).in order to built 2 x ), 3x ), Initial dust exposure years( 4x ), exposure time( 5x ), Initial dust exposure age( Born years( the multiple linear regression equation we select the full into method. Table 3 is the parameter estimation for the regression equation, the value of P for the constant term is 0.338>0.05, did’t have statistical significance, so the regression equation without it is : 569 . 0 081 . 0 914 . 2 660 . 2 897 . 0 354 . 1 x x x x x x y 1 2 3 4 5 6 145
Jianhui Wu et al ______________________________________________________________________________ J. Chem. Pharm. Res., 2014, 6(3):141-148 Table3: the parameter estimation for the regression equation model parameter Constant 1x 2 x 3x 4 x 5x 6x B Beta - P 2.232 2.326 1.354 0.166 -0.897 0.301 2.660 0.690 2.914 0.692 -0.081 0.032 0.569 0.087 0.338 0.206 0.000 0.301 0.011 0.341 0.000 0.359 0.000 -0.063 0.011 0.232 0.000 3 The linear combination model based on the minimum prediction error sum of squares 103 . 0 897 . 0 Y Y Y 3 1 2 Utilizing BP neural network model and multiple linear regression model and fitting values of the training and test sets collection of samples of coal workers pneumoconiosis seniority Y1, Y2 as the independent. According to the principle the square of the prediction error is the minimum, the predicted weights vector of the combination of methods by calculating from the model formula derived vector is (W1, W2) = (0.897, 0.103).According to the principle of the minimum prediction error sum of squares, the combination forecast weight vector quantity of the method based on the formular of the model is (w1,w2) = (0.897, 0.103). The Linear combination model is . 0 897 . 0 Y Y 103 Y 3 1 2 According the setting model, the input is the prediction value of the coalworker pneumoconiosis’s work year based on the simulation sample from the two models, to predict the coalworker pneumoconiosis’s work year (Y3) of the simulation sample. ④The linear combination forecasting model based on the minimum sum of the prediction error absolute value. Applying BP neural network model and multiple linear regression models, the fitted value Y1, Y2 of coal workers’ pneumoconiosis seniority of the collection samples of the training and test sets are viewed as the independent variable. According to the principle that the square sum of the prediction error is the smallest, calculating by the model formulate, the combination prediction weights vector is (W1, W2) = (0.851, 0.149). Established linear combination model is following, which is based on the principle that the sum of prediction error absolution value is the smallest and used to predict the coal workers’ pneumoconiosis seniority of model. 149 . 0 851 . 0 Y Y Y 4 1 2 The predictive value of coal workers’ pneumoconiosis seniority in single model simulation samples as input, coal workers’ pneumoconiosis seniority of the predictive simulation samples is Y4. ⑤ BP neural network combined forecasting model The structural parameter of the model is in table 4. 146
Jianhui Wu et al ______________________________________________________________________________ J. Chem. Pharm. Res., 2014, 6(3):141-148 Table 4: The main parameters of the BP neural network model structural parameters of the net hidden layers :1 the number of hidden layer neurons:2 the number of input layer neurons:2 the number of output layer neurons:1 The activation function of input layers:Sigmoid The activation function of output layers:Sigmoid Training parameters of the net training algorithm:gradient descent the iterations untile stop training:2 Rate of study:0.1 Performance function:SSE Training set when stop train SSE=0.866 Test set when stop train SSE=0.260 The comparison of the prediction results and performance among this model. 1 Prediction results of the simulation sets from various model Five models predicted results shown that there are no statistically significant difference between the predicted value and the true value. BP neural network, multiple linear regression, combination prediction of the smallest prediction error sum of squares, combination prediction of the smallest prediction error sum of absolution values , besides the prediction results of BP neural network combined model for coal workers’ pneumoconiosis seniority contain the relative error median(M),the quartile pitch(Q) and the mean relative error(MRE) ,these values are shown in the chart 8.The prediction accuracy of 91.023%, 88.908%, 91.048%, 91.037% and 91.277%,are close to or greater than 90%,it may be acceptable that the prediction accuracy of five models is greater, but there are gaps between the ideal average of 5% relative error[10]. Table 5: the relative error of the prediction from the simulation of the Mono model and combined model Prediction model BP neural network MLR The combination of Least Sum of Square Error The combination of the least absolute error The combination of the BP neural network M(%) 7.143 8.571 7.241 7.265 7.207 Q(%) 11.765 11.480 11.649 11.684 9.918 MRE(%) 8.977 11.092 8.952 8.963 8.723 ②The analysis of various model’s prediction performance Applying to Non-parametric tests of multiple samples among different relative error of the predictive value of the different model simulation, using the Friedman test, x2=9.466, p=0.024<0.05, the difference was statistically significant, that is, there is the differences at least between the two sets of relative error of model predictive value. Mean rank inferred that BP neural network combined model is best ,followed by the combination models that its the sum of square of the error is the smallest and it’s the sum of absolute error is the smallest, BP neural network model, multiple linear regression model is the worst. There exist the difference between multiple linear regression and the other four models, addition to the multiple linear regression, the difference between the other four models was not statistically significant. Table 6: the comparison of the relative error among the simulation prediction of these models χ2 Prediction model Mean Rank 2.45 2.79 2.39 2.40 2.37 P BP neural network * 2MLR The combination of Least Sum of Square Error* The combination of the least absolute error * The combination of the BP neural network* note:comparison ,*means that the difference has statistical significance 9.466 0.024 CONCLUSION 1) Because of the prediction accuracy is above normal of the BP neural network and the performance is better than the multiple linear regressions, so it could be used to predict the work year of the coalworker pneumoconiosis. 2) The prediction performance comparison of the five models:the worst model is multiple linear regression, but the other four models has has little difference; compared the value from predictable performance measure of the model can be obtained that combined model is better than unitary model,nonlinear model is better than linear model.and the Nonlinear BP neural network combination model is the best among this models. 147
Jianhui Wu et al ______________________________________________________________________________ J. Chem. Pharm. Res., 2014, 6(3):141-148 Acknowledgements This work is supported by Hebei Science and Technology Funds (11276911D), program of Tangshan Science and Technology Research and Development (11150205A-3), the accented term of Health Department of Hebei Province (20120146). REFERENCES [1]Seott DF, Grayson RL, Metz EA, Occupation and Environmental Medicine, 2004, Vol. 46, No.12, pp.1272-1277. [2]Simon HD Mamuya, Magne Bratveit, Yohana Mashalla, et al, A cross sectional study.BMC Public Health, 2007, No.7, pp.17-24. [3]Yongli Yang,Hongzhi Liu,et al, Chinese Journal of Coal Industry Medicine, 2007, Vol.10, No.5, pp.593-595. [4]Duh MS, Walker A, Ayanian J Z, Am J Epidemiology, 2004, No. 14, pp.464-471. [5]Suarthana E,Moons KG,Heederik D,et al. Occupation and Environmental Medicine, 2007, Vol. 64, No.9, pp. 595- 601. [6]TIAN Lu-jia, LIU Hong-bo, YANG Yong-li, et al, Chinese Journal of Industrial Medicine, 2009, Vol. 22, No.2, pp.127-128. [7]CHEN Yin-pin, FAN Hong-min, YUAN Ju-xiang, et al, Chinese Journal of Public Health, 2009, Vol.25, No.5, pp.623-624. [8] Bartfay E, Mackillop WJ, Peter JL, Eur J Cancer Care (Engl), 2006, Vol.15, No. 2, pp.115-124. [9]Donaldson,R.G, M.Kamstra, Journal of Forecasting, 1996, No.15, pp.49-61. [10]Simon HD Mamuya, Magne Bratveit, Yohana Mashalla, et al, A cross sectional study.BMC Public Health, 2007, No.7, pp.17-24. 148