Download
1 / 2
0 likes | 2 Vues
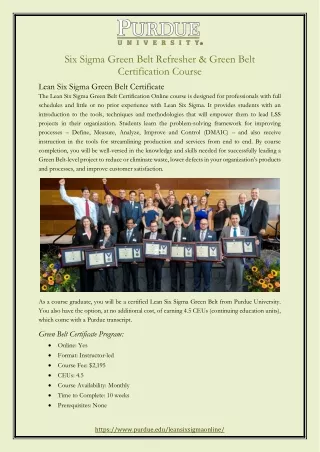
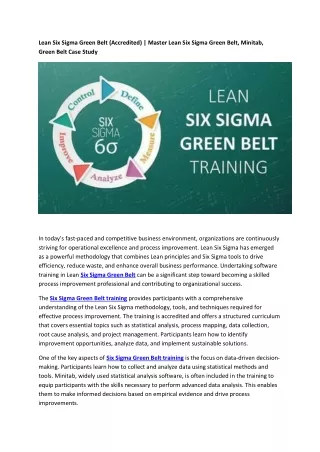
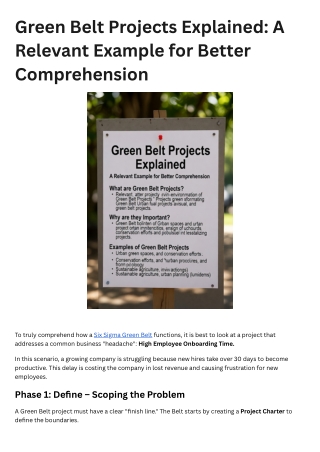
To truly comprehend how a Six Sigma Green Belt functions, it is best to look at a project that addresses a common business "headache": High Employee Onboarding Time.<br><br>In this scenario, a growing company is struggling because new hires take over 30 days to become productive. This delay is costing the company in lost revenue and causing frustration for new employees.

E N D
Green Belt Projects Explained: A Relevant Example for Better Comprehension To truly comprehend how a Six Sigma Green Belt functions, it is best to look at a project that addresses a common business "headache": High Employee Onboarding Time. In this scenario, a growing company is struggling because new hires take over 30 days to become productive. This delay is costing the company in lost revenue and causing frustration for new employees. Phase 1: Define – Scoping the Problem A Green Belt project must have a clear "finish line." The Belt starts by creating a Project Charter to define the boundaries.
Problem: The average time from "Day 1" to "First Productive Task" is 35 days. Goal: Reduce the onboarding time to 15 days within 5 months. VOC (Voice of the Customer): New hires and Department Managers are the "customers." They want speed and clarity. Phase 2: Measure – Mapping the Current State The Green Belt doesn't guess where the delay is; they use data to find it. Process Mapping: They create a SIPOC diagram to visualize the flow from HR to IT to the new hire's desk. Data Collection: They track the timestamps for the last 50 hires to find the "bottlenecks." Measurement Integrity: They perform a Gage R&R to ensure all managers are defining "First Productive Task" in the same way. Phase 3: Analyze – Isolating the Root Cause Now, the Green Belt uses statistical and visual tools to find the "Vital Few" reasons for the 35-day delay. Pareto Analysis: A Pareto Chart reveals that 70% of the delay is caused by "Waiting for IT Hardware" and "Missing Software Permissions." Root Cause Analysis: Using a Fishbone (Ishikawa) Diagram, they discover the root cause: HR doesn't notify IT until the employee actually arrives on Day 1. Phase 4: Improve – Designing the Solution The Green Belt applies Lean principles to remove the "Waiting" and "Processing" waste. Lean Tool: They implement a "Standardized Work" trigger. The moment a candidate signs an offer letter, an automated ticket is sent to IT to prep equipment. Mistake Proofing (Poka-Yoke): They create a digital checklist that prevents an HR file from being "Closed" until the IT department confirms hardware delivery. Phase 5: Control – Sustaining the Results To ensure the process doesn't revert to 35 days, the Green Belt locks in the new method. Standardization: The new workflow is written into the Standard Operating Procedures (SOPs). Monitoring: They implement a Control Chart (SPC). The HR Manager monitors this weekly. If the onboarding time for a new group creeps above 20 days, the chart signals an "out-of-control" point for immediate investigation. Why This is a "Textbook" Green Belt Project 1. Localized Scope: It stayed within HR and IT onboarding. 2. Data-Driven: Decisions were based on lead times, not "feelings." Measurable ROI: By getting employees productive 20 days sooner, the company gains hundreds of hours of billable work.
![Six Sigma [Green Belt Project]](https://cdn0.slideserve.com/646243/six-sigma-green-belt-project-dt.jpg)