HEALTHCARE ACCESS CALL CENTER
110 likes | 591 Vues
This presentation will probably involve audience discussion, which will create action items. Use PowerPoint to keep track of these action items during your presentation In Slide Show, click on the right mouse button Select “Meeting Minder” Select the “Action Items” tab

HEALTHCARE ACCESS CALL CENTER
E N D
Presentation Transcript
This presentation will probably involve audience discussion, which will create action items. Use PowerPoint to keep track of these action items during your presentation • In Slide Show, click on the right mouse button • Select “Meeting Minder” • Select the “Action Items” tab • Type in action items as they come up • Click OK to dismiss this box • This will automatically create an Action Item slide at the end of your presentation with your points entered. HEALTHCARE ACCESS CALL CENTER HEALTHCARE ACCESS CALL CENTER Improving the Call Abandonment Rate Team: HACC Staff Members, Geri Binion, Regina Braxton, Jelada Huff, Yvette Lugo, Evelia Oseguera, Kathy Ragusa
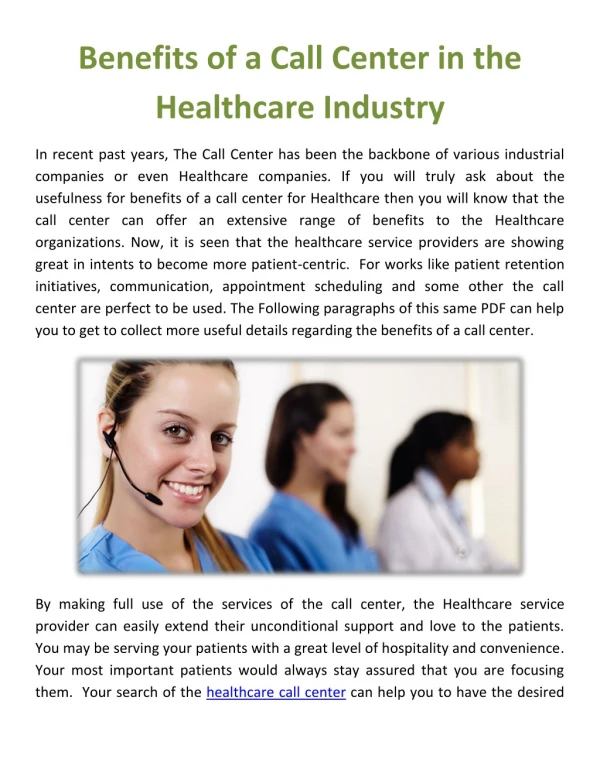
Opportunity Statement The Healthcare Access Call Center provides patients with initial access to Loyola physicians and services. This access to our schedulers in a timely manner is essential to our customer satisfaction. With our call abandonment rate goal set at 2%, our average abandonment rate rose to 10% in February 2002. A call is considered abandoned if a customer hangs up prior to a scheduler coming on the line. When our average abandonment rate began to increase, we saw an opportunity to improve our efficiency while striving to achieve our abandonment rate goal of 2%. The ability to maintain our goal is essential to achieve satisfaction for each of our customers - patients, staff and physicians. .
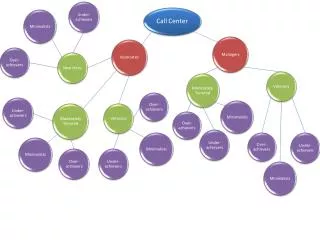
Most Likely Causes for Current Opportunity • Increase in volume of calls • Appropriate FTES for total volume and pattern of calls • Productivity of staff • System flow of phone calls to staff
SolutionsImplemented • Established productivity standard -150 calls/day per service rep. • Established standard of 2 hours (max) of auxed off time. • Abandonment rates shared on a daily basis, by POD and overall. • Implemented monthly reward for POD with lowest rate. • Highest scheduler for the month is acknowledged by team. • Schedules, lunches and breaks adjusted to have optimal staff during busiest time for incoming calls. • Phone calls directed to POD, then to first available scheduler. • External phone activity shared with individual staff. • Additional 1.0 FTE added to meet 10% increase in call volume. • Hired 3 bi-lingual employees. • Established Spanish speaking voice mail system. • Bi-weekly meetings held with team leaders, manager and director to review activities.
Healthcare Call Access Center Abandonment Rate Pre-Project Project 20 15 Mean: 7.0 10 Abandon Rate (%) 5 Mean: 4.1 0 -5 Mar 03 Mar 01 Jun 01 Jun 02 Sep 00 Sep 02 Dec 00 Dec 01 Dec 02 Mar 02 Sep 01 Month Confidential: For Quality Improvement Purposes
Next Steps • Continue to monitor and adjust our activities to meet our abandonment rate goal of 2%. • Continue to involve staff members in decision making to ensure success. • Establish process improvement incentives for employees as a pilot program in FY04.