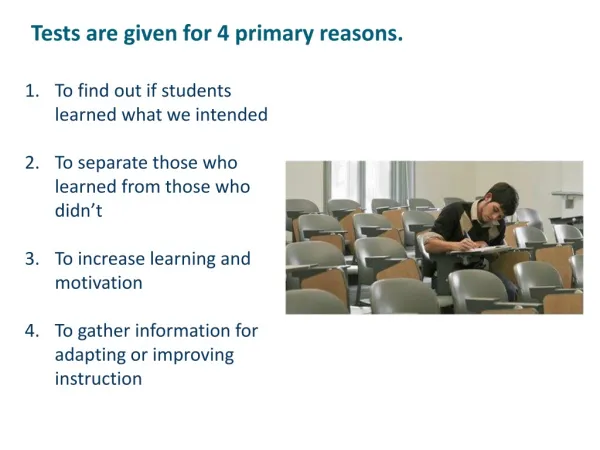
Tests are given for 4 primary reasons.
Tests are given for 4 primary reasons. To find out if students learned what we intended To separate those who learned from those who didn’t To increase learning and motivation To gather information for adapting or improving instruction.

Tests are given for 4 primary reasons.
E N D
Presentation Transcript
Tests are given for 4 primary reasons. To find out if students learned what we intended To separate those who learned from those who didn’t To increase learning and motivation To gather information for adapting or improving instruction
Multiple choice items are comprised of 4 basic components. Stem The rounded filling of an internal angle between two surfaces of a plastic molding is known as the rib. fillet. chamfer. Gusset plate. Distracters Options Key
An item analysis focuses on 4 major pieces of information provided in the test score report. Test Score Reliability Item Difficulty Item Discrimination Distracter information
Test score reliability is an index of the likelihood that scores would remain consistent over time if the same test was administered repeatedly to the same learners. Reliability coefficients range from .00 to 1.00. Ideal score reliabilities are >.80. Higher reliabilities = less measurement error. On our new item analysis we use Cronbach’s Alpha!
Test score reliabilities that are >.80 have less measurement error
Item Difficulty is the percentage of students who answered an item correctly.
Easieritems have higher item difficulty values. Moredifficultitems have lower item difficulty values.
An ‘ideal’ item difficulty statistic depends on 2 factors. Number of alternatives for each item. The reason for asking the question.
Sometimes exams include very easy or very difficult items on purpose. Why difficult items? Why easy items? Deliberately including difficultitems may be meant to challenge students’ thinking? Easy items may be included to test basic information or to boost students’ confidence?
Item Discriminationis the degree to which students with high overall exam scores also got a particular item correct. • Represented by Point Biserial Correlation (PBC),it tells how well an item ‘performed’ Ranges from -1.00 to 1.00 and should be >.2 • You want the better students to get the questions correct, regardless of difficulty!
A well-performing item. A poor-performing item.
An ‘ideal’ item discrimination statistic depends on 3 factors. Item Difficulty Test heterogeneity Item characteristics
Item difficulty Yet… Very easy or very difficult items will have poor ability to discriminate among students. Very easy or very difficult items may still be necessary to sample content taught.
Test heterogeneity Yet… A test that assesses many different topics will have a lower correlation with any one content-focused item. A heterogeneous item pool may still be necessary to sample content taught.
Item quality A poorly written item will have little ability to discriminate among students. There is no substitute for a well-written item or for testing what you teach! and…
Now look at the item effects from your analysis. Which items performed ‘well’? Did any items perform ‘poorly’?
Distracter information can be analyzed to determine which distracters were effective and which ones were not. • In this case most of the students were able to choose the correct option. If this was intentional, then it is a good question. Intent is everything! Otherwise these may have been poor distractors.
For question 6, there is a split between two distractors. It is considered a good question because most of the students who got it correct were high scoring. • For question 8, the split is lower, and incorrect distractor probably drew some of the higher scoring students.
Whether to retain, revise, or eliminate items depends on item difficulty, item discrimination, distracter information,and your instruction. • Distracters • Instruction Ultimately, it’s a judgment call that you have to make.
What if I have a relatively short test or I give a test in a small class? I might not use the testing service for scoring. Is there a way I can understand how my items worked? Yes.
From: Suskie, L. (2009). Assessing student learning: A common sense guide (2nd ed.). San Francisco: Jossey-Bass. • 1. Which item is the easiest? • 2. Which item shows negative (very bad) discrimination? • 3. Which item discriminates best between high and low scores? • 4. In Item 2, which distracter is most effective? • 5. In Item 3, which distractermust be changed?
Even after you consider reliability, difficulty, discrimination, and distracters, there are still a few other things to think about… Multiple course sections Student feedback Other item types