
Testing slide
E N D
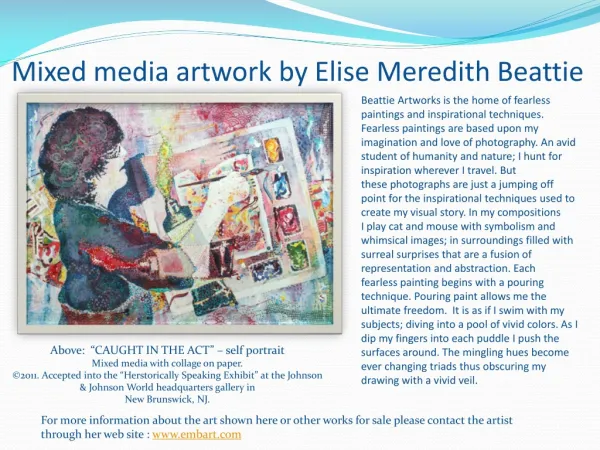
Presentation Transcript
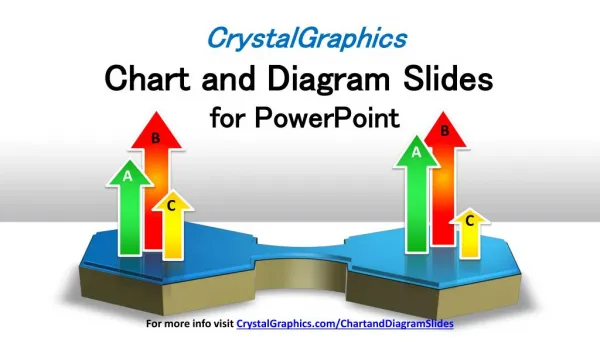
CrystalGraphics Chart and Diagram Slides for PowerPoint B B A A C C For more info visit CrystalGraphics.com/ChartandDiagramSlides
(and we’ve made them better) For more info visit CrystalGraphics.com/ChartandDiagramSlides
PowerPoint’s default “Pie of Pie” diagram For more info visit CrystalGraphics.com/ChartandDiagramSlides
Our improved“Pie of Pie” diagram For more info visit CrystalGraphics.com/ChartandDiagramSlides
Now here are some charts with example data… For more info visit CrystalGraphics.com/ChartandDiagramSlides
ANIMATED – PHASE DIAGRAM - Example of: Business Cycle Phase 1 Phase 2 Phase 3 Phase 4 A phase diagram is a circle divided into sectors which each represent a proportion of the whole. Contraction - When the economy starts slowing down. Trough - When the economy hits bottom, usually in a recession. Expansion - When the economy starts growing again. Peak - When the economy is in a state of "irrational exuberance." For more info visit CrystalGraphics.com/ChartandDiagramSlides
3-D COLUMN {DATA DRIVEN} - Example of: Global Sales A 3D column chart shows the changes in a data series over time or compares multiple items. For more info visit CrystalGraphics.com/ChartandDiagramSlides
ANIMATED – GEARS PROCESS DIAGRAM - Example of: Fabulous Customer Service A Gears Process diagram is used to show interlocking ideas. Approachability Make it easy for your customers to contact you, and take every opportunity to reduce friction. Write like you talk You should be friendly- like if you were meeting a new person in real life. Offer a solution Offer a path forward- a quick explanation of what’s going wrong, and assurance that you’re fixing the specific issue at hand. For more info visit CrystalGraphics.com/ChartandDiagramSlides
PIE CHART {DATA DRIVEN} – Example of: Cookie Sale Cookie Sales Chocolate chip vs. sugar cookies. 15% sales went to sugar. Chocolate chip rules! A pie chart is a circle divided into sectors which each represent a proportion of the whole. For more info visit CrystalGraphics.com/ChartandDiagramSlides
ANIMATED - PRESENTATION AGENDA - Example of: Presentation about Bees Introduction 1 Importance of Bees 2 Swarming 3 Challenges Today 4 A Presentation Agenda diagram serves as a guide post for your presentation. For more info visit CrystalGraphics.com/ChartandDiagramSlides
BUSINESS CYCLE DIAGRAM - Example of: Sector Rotation Why it Matters: The strategy suggests investors can generate profits by watching the business cycle and buying or selling stocks based on how they perform at each stage in the cycle. Energy Health Care Typical Sector Rotation through an Average Business Cycle Materials Utilities EXPANSION CONTRACTION Technology Financials The Business Cycle Diagram represents the recurring and fluctuating levels of economic activity that an economy experiences over a long period of time.
ANIMATED - MAP DIAGRAM - Example of: Blogger Stats 1. 800 visitors 2. 122 visitors 2. 1. 3. 67 visitors 3. 4. 12 visitors 4. The Map diagram links elements of the domain and range. For more info visit CrystalGraphics.com/ChartandDiagramSlides
CALENDAR TIMELINE DIAGRAM - Example of: Climate Action Campaign March 23rd Focus on biking/walking. T shirts. January 3rd Hold contest for energy saved. Launch media event. APR JAN FEB MAR 31 3 15 23 DEADLINE April 31st Press release with campaign success metrics. Actions list. February 15th Email newsletter. Recognize top campaign participants. A Calendar Timeline Diagram shows key days leading up to a deadline. For more info visit CrystalGraphics.com/ChartandDiagramSlides
ANIMATED – CALLOUT DIAGRAM - Example of: The Perfect Team Accurate Accountant Eloquent Speaker Computer Whiz Talented Artist The Perfect Team The Callout diagram allows users to set up and maintain association relationships. For more info visit CrystalGraphics.com/ChartandDiagramSlides
SEGMENTED PYRAMID - Example of: Product Management Product Management Is directly related to Product Strategy, Product Development, Product Marketing As a product manager, your area is to make the product successful. A Segmented Pyramid diagram is used to show containment, proportional, or interconnected relationships. For more info visit CrystalGraphics.com/ChartandDiagramSlides
ANIMATED - KEY DIAGRAM - Example of: Magazine Growth Hire advertising agency, make subscribers pay less, revamp entire concept. Not enough subscribers to support growth of magazine. A Key diagram shows where major development will take place. For more info visit CrystalGraphics.com/ChartandDiagramSlides More subscribers, new magazine concept and successful advertising campaign.