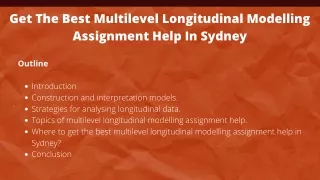
Nonparametric Methods for Analyzing Longitudinal Data for Biostatistics Assignment Help
Learn nonparametric methods for analyzing longitudinal data with coding examples in R and Python. Get biostatistics assignment help for accurate analysis of your data.<br>


Nonparametric Methods for Analyzing Longitudinal Data for Biostatistics Assignment Help
E N D
Presentation Transcript
Tutorhelpdesk.com NONPARAMETRIC METHODS for Analyzing LONGITUDINAL DATA BIOSTATISTICS ASSIGNMENT GUIDE
Introduction Tutorhelpdesk.com WHAT IS LONGITUDINAL DATA? DEFINITION Longitudinal data is data that has been collected on the same subjects continuously and at multiple intervals. This type of data is used to track the changes and patterns which is essential for the field of biostatistics notably in medical and public health research. 2
Introduction Tutorhelpdesk.com Introduction EXAMPLES • Week-long recording of a patient’s blood pressure. • Measure a child’s height and weight and compare them later to ensure they follow the right growth pattern. • Measuring how well a new drug is performing in comparison to older drugs after two years of usage. KEY FEATURES • Observations made multiple times over a period on the same individual. • Correlations between measurements on the same subject. 3
Why nonparametric method is used for Longitudinal data? Tutorhelpdesk.com Introduction • No Assumptions About Data Distribution: Non-parametric techniques are techniques in which data does not need to be normally distributed. • Robustness: Particularly suitable for skewed data, or data having outliers, or small sample sizes. • Flexibility: Applicable on categorical, ordinal, and other qualitative data. SCENARIOS WHERE NONPARAMETRIC METHODS ARE USEFUL: • When the population is small. • When the distribution of the population from which the sample has been drawn cannot be ascertained or, it is non-normal. • Whenever you are working with the rankings or scores or ordinal outcome. 4
Common Nonparametric Techniques in Analysis of Longitudinal Data Tutorhelpdesk.com Introduction Sign Test and Wilcoxon Signed Rank Test • Kruskal-Wallis Test • Friedman Test • Kaplan-Meier Estimator 5
1. Sign Test and Wilcoxon Signed Rank Test Tutorhelpdesk.com Introduction PROCEDURE • Purpose: Compare two sets of results on the same subjects – paired data analysis (Before and After treatment). • Example Scenario: Conducting hypothesis whether a special diet type does or does not influence the cholesterol levels in the patients. • Order the differences between paired measurements. • Don’t consider the signs of differences (either positive or negative). • Rather than the raw values, it is the ranks that have to be analyzed. EXAMPLE IN R # Hypothetical cholesterol levels before and after intervention before <- c(200, 220, 180, 210, 195) after <- c(190, 210, 185, 200, 185) # Wilcoxon Signed-Rank Test wilcox.test(before, after, paired = TRUE, exact = FALSE) 6
2. Kruskal-Wallis Test Tutorhelpdesk.com Introduction EXAMPLE IN PYTHON (USING SCIPY) • Purpose: Compare three or more groups for ordinal or continuous data. • Example Scenario: Statistically assessing whether patient samples from three treatment groups have different recovery rates over time. from scipy.stats import kruskal # Recovery rates in three treatment groups group1 = [3.2, 2.8, 3.5, 3.0] group2 = [3.8, 3.7, 4.0, 4.1] group3 = [2.9, 3.1, 3.3, 3.2] # Kruskal-Wallis Test stat, p = kruskal(group1, group2, group3) print(f"Kruskal-Wallis statistic: {stat}, p-value: {p}") PROCEDURE • Analyse all the data and rank them in order. • compare mean ranks between groups. 7
3. Friedman Test Tutorhelpdesk.com Introduction EXAMPLE IN R • Purpose: The many-measures data are analyzed over multiple conditions. • Example Scenario: Pain scores are measured at 3 different periods post surgery on patients (e.g., Day 1, Day 3, and Day 7). # Pain scores across time points pain_scores <- matrix(c(4, 3, 2, 5, 4, 3, 6, 5, 4), nrow = 3, byrow = TRUE) # Perform Friedman test friedman.test(pain_scores) PROCEDURE • Rank data for each subject across time points. • Compute the test statistics using rank sums. 8
4. Kaplan-Meier Estimator (Nonparametric Survival Analysis) Tutorhelpdesk.com Introduction EXAMPLE IN PYTHON • Purpose: The estimate of time-to-event data under no habit of distribution. • Example Scenario: A drug is administered to the patients, and the survival rates are studied. from lifelines import KaplanMeierFitter import matplotlib.pyplot as plt # Time-to-event data time = [5, 6, 6, 2, 4, 8, 10] event = [1, 1, 0, 1, 0, 1, 1] # 1: Event occurred, 0: Censored # Kaplan-Meier Estimator kmf = KaplanMeierFitter() kmf.fit(time, event) kmf.plot_survival_function() plt.title("Kaplan-Meier Survival Curve") plt.show() PROCEDURE • Estimate survival probability at each time point. • Plot survival curves. 9
Difficulties in the analysis of longitudinal data Tutorhelpdesk.com Introduction • Complexity of Dependencies: Analzying the correlations between the same subject across time is not easy. • Reduced Power: Nonparametric tests can however be lower in terms of power as compared to parametric tests. • Computational Intensity: Certain techniques are computationally intensive particularly when handling big data. 10
Strengths of Nonparametric Techniques Tutorhelpdesk.com Introduction • Versatile: Can manage many types of data (ordinal and categorical). • Fewer Assumptions: One does not need to normality or equal variance. • Robustness: Overall it is less affected by outliers and skewed data. TIPS FOR STUDENTS • Understand the structure of data before proposing the method. • View the data using charts, like a box plot or time series plot for any trends or patterns. • Always check that the parametric assumptions are met before they prefer a nonparametric alternative. • Become conversant with statistical packages such as R, Python, SPSS, or SAS. 11
Looking for Biostatistics Assignment Help? Tutorhelpdesk.com Introduction Our biostatistics assignment helpis more than just a provider of solutions-it is your gateway toward mastery of the subject. By entrusting us with this task, students receive precise, well-structured solutions, which act as self-explanatory guide to understand how to solve biostatistical problems correctly. The guidance provided will assist in completing assignments and skills for the real-world application and knowledge of biostatistics. Our support covers popular statistical software, including R, Python, SPSS, SAS and Stata, ensuring you are well prepared for sound data analyses. Our team of biostatistics experts start from the basics of what hypothesis testing is, regressions, survival analysis, and other important topics. We cater to all study levels-from novices who have problems with the most-basic concepts to advanced learners holding complex datasets. Empower yourself with theoretical and practical knowledge for excelling in biostatistics, which will not only help you through your course but also boost your employment options. Choose us for dependable, educational support and pursue your academic issues with confidence. 12
Conclusion Tutorhelpdesk.com Nonparametric methods are powerful and indispensable yet highly potent tools for longitudinal data analysis when data assumptions are violated. They show robustness, flexibility, and applicability to small or non-normal datasets. By knowing these methods, students will have an easier understanding of analyzing complex biostatistical data and improve their research and analysis skills. 13
Questions for Self-Review Tutorhelpdesk.com • why nonparametric methods are more appropriate for skewed data in longitudinal studies? • Compare the differences between the Wilcoxon Signed-Rank Test and the Kruskal-Wallis Test? • In what way does the Kaplan-Meier estimator deal with censored data in survival analysis? 14
Recommended Textbooks Tutorhelpdesk.com “Nonparametric Statistical Methods" by Myles Hollander and Douglas A. Wolfe "Applied Longitudinal Analysis" by Garrett M. Fitzmaurice, Nan M. Laird, and James H. Ware "Practical Nonparametric Statistics" by W.J. Conover "Introduction to the Practice of Statistics" by Moore, McCabe, and Craig 15
Tutorhelpdesk.com Thank You www.tutorhelpdesk.com +1-617-807-0926 hw@tutorhelpdesk.com