Download
1 / 15
150 likes | 166 Vues
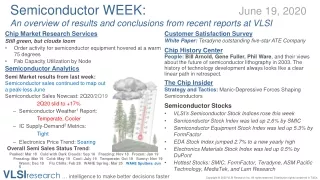
Visit: https://bit.ly/3fWrTUX<br>Semiconductor sales continued to map out a peak-less June, due to the transition from phase 1 of the WAHE to phase 2 with a primary demand drop. The Supply-Demand 2Q20 Nowcast stayed tight. The 2Q20 Nowcast slipped back for the second time since late April.

E N D
Semiconductor WEEK: June 19, 2020 An overview of results and conclusions from recent reports at VLSI Chip Market Research Services Still green, but clouds loom • Order activity for semiconductor equipment hovered at a warm 75 degrees • Fab Capacity Utilization by Node Semiconductor Analytics Semi Market results from last week: Semiconductor sales continued to map out a peak-less June Semiconductor Sales Nowcast: 2Q20/2Q19 2Q20 slid to +17% – Semiconductor Weather1Report: Temperate, Cooler – IC Supply-Demand2Metrics: Tight – Electronics Price Trend: Soaring Overall Semi Sales Status Trend: Peaked: Mar 18 Cold with Dark Clouds: Sep 18 Freezing: Nov 18 Frozen: Jan 19 Freezing: Mar 19 Cold: May 19 Cool: July 19 Temperate: Oct 19 Sunny: Nov 19 Warm: Dec 19 Flu Chills: Feb 28 WAHE Spring: Mar 25 WAHE Sputters: Jun 5 Customer Satisfaction Survey White Paper: Teradyne outstanding five-star ATE Company Chip History Center People: Bill Arnold, Gene Fuller, Phil Ware, and their views about the future of semiconductor lithography in 2003. The history of technology development always looks like a clear linear path in retrospect. The Chip Insider Strategy and Tactics: Manic-Depressive Forces Shaping Semiconductors Semiconductor Stocks • VLSI’s Semiconductor Stock Indices rose this week • Semiconductor Stock Index was led up 2.6% by SMIC • Semiconductor Equipment Stock Index was led up 5.3% by FormFactor • EDA Stock Index jumped 2.7% to a new yearly high • Electronics Materials Stock Index was led up 0.5% by DuPont • Hottest Stocks: SMIC, FormFactor, Teradyne, ASM Pacific Technology, MediaTek, and Lam Research VLSIresearch … intelligence to make better decisions faster Copyright © 2020 VLSI Research Inc. All rights reserved. Distribution rights contained in T&Cs.
outstanding five-star ATE Company VLSIresearch Customer Satisfaction Survey 2020 Click for White Paper VLSIresearch … intelligence to make better decisions faster Copyright © 2020 VLSI Research Inc. All rights reserved. Distribution rights contained in T&Cs.
Teradyne Awarded as 10 BEST and THE BEST Supplier Customers award Teradyne with 5 VLSI stars in 10 BEST Large Chip Making Equipment and THE BEST Test Equipment Supplier of 2020 – earns their best-ever score of 9.48 – among the elite few to be honored as a 10 BEST supplier since the survey’s launch 32 years ago Teradyne is an exceptional five-star supplier of products to test semiconductors and automate manufacturing processes – focus on testing and helping to build the world’s most innovative products with industry-leading customer satisfaction • • Click for White Paper VLSIresearch … intelligence to make better decisions faster 3 Copyright © 2020 VLSI Research Inc. All rights reserved. Distribution rights contained in T&Cs.
How Customers Perceive Teradyne Improves ratings in 6 rating categories by 10 basis points Earns highest score of all 10 BEST Large Chip Making Equipment Suppliers and THE BEST Test Equipment Suppliers in 4 categories Highest scores* – recommend supplier – trust in supplier – technical leadership – partnering – support after sales – product performance – quality of results – overall value – uptime *Listed in order of rating • • • Click for White Paper VLSIresearch … intelligence to make better decisions faster 4 Copyright © 2020 VLSI Research Inc. All rights reserved. Distribution rights contained in T&Cs.
The Chip Insider®'s Graphics File May 2020 Still green, but clouds loom Order activity for semiconductor equipment hovered at a warm 75 degrees as the increases in Memory and Subcon/Adv Packaging were largely offset by the decline in SOC Mobile The latter continued to trend lower amid growing uncertainties over the U.S. sanctions on Huawei Memory activity hit a new high for the year and it’s finally in positive territory With Advanced Logic and Foundry spending expected to abate in 2H20, Memory will need to pick up momentum in order to keep equipment spending in positive territory VLSI’s Chip Price Performance Index (CPPI) lost momentum slipping one point • • This issue contains the latest forecast. • • • VLSIresearch … intelligence to make better decisions faster Call us to access more details Copyright © 2020 VLSI Research Inc. All rights reserved. Distribution rights contained in T&Cs.
VLSI's Current Forecast Forecast as of May 2020: Semi Equipment ($B): Sequential Change Capacity Utilization: ICs ($B): Sequential Change IC Units (BU): Sequential Change Electronics ($B) : Sequential Change 2021 88.1 $ 6.5% 95.2% 408.6 $ 15.2% 334.4 12.8% 2,284 $ 13.0% 2019 77.0 $ -8.0% 84.6% 352.3 $ -13.4% 299.4 -6.0% 2,122 $ -2.0% 2020 82.7 $ 7.3% 88.6% 354.8 $ 0.7% 296.4 -1.0% 2,020 $ -4.8% Severe COVID-19 impact in 2H20, recovery 2021 Forecast as of May 2020: Semi Equipment ($B): Sequential Change ICs ($B): Sequential Change IC Units (BU): Sequential Change Electronics ($B) : Sequential Change 2021 88.1 $ 23.8% 408.6 $ 23.5% 334.4 20.9% 2,284 $ 21.2% 2019 77.0 $ -8.0% 352.3 $ -13.4% 299.4 -6.0% 2,122 $ -2.0% 2020 71.2 $ -7.6% 330.8 $ -6.1% 276.6 -7.6% 1,884 $ -11.2% VLSIresearch … intelligence to make better decisions faster Copyright © 2020 VLSI Research Inc. All rights reserved. Distribution rights contained in T&Cs.
The Chip Insider®Graphics Capacity Utilization by Node: – Utilization rates are improving across the board Fab Capacity Utilization by Node: chart gives rolling averages for 20nm 22nm 28nm 32nm 40nm 45nm 60nm 65nm and larger VLSIresearch … intelligence to make better decisions faster Copyright © 2020 VLSI Research Inc. All rights reserved. Distribution rights contained in T&Cs.
Semiconductor Analytics Last Week in the Semiconductor Market: Semiconductor sales continued to map out a peak-less June, due to the transition from phase 1 of the WAHE to phase 2 with a primary demand drop. The Supply-Demand 2Q20 Nowcast stayed tight. The 2Q20 Nowcast slipped back for the second time since late April. W/W: Week-over-Week sequential growth W/Q: Week-over-Quarter W/Y: Week-over-Year Semiconductor Sales Nowcast: 2Q20/2Q19 2Q20 slid to +17% Semiconductor Weather1Report: 72˚ F Temperate, Cooler IC Supply-Demand2Metrics: Tight Electronics Pricing Trend: Soaring Thank you for supporting us through this last issue of 2018. Semiconductor Analytics will return January . Overall Semi Sales Status Trend: Peaked: Mar 18 Cold with Dark Clouds: Sep 18 Freezing: Nov 18 Frozen: Jan 19 Freezing: Mar 19 Cold: May 19 Cool: July 19 Temperate: Oct 19 Sunny: Nov 19 Warm: Dec 19 Flu Chills: Feb 28 WAHE Spring: Mar 25 WAHE Sputters: Jun 5 1: Measures Order Activity 2: Measures Pricing Power VLSIresearch … intelligence to make better decisions faster 8 Copyright © 2020 VLSI Research Inc. All rights reserved. Distribution rights contained in T&Cs.
2020 Semiconductor Market Drivers Integrated Circuit sales are weakening with the end of phase 1 of the WAHE: • Certainties: – Coronavirus Pandemic infected economies • Unparalleled Supply and Demand shocks to IC sales of <10% and units of ~20% – Governments defibrillating economy – Macroeconomic ‘V’acuum or ‘U’ – not ‘L’ – World’s Economy saved by Semiconductors – WAHE (Work-At-Home Economy) – 7/10nm and 5/7nm demand ramps • Uncertainties: – U.S.-China Trade War – 2020 Elections in U.S. VLSIresearch … intelligence to make better decisions faster 9 Copyright © 2020 VLSI Research Inc. All rights reserved. Distribution rights contained in T&Cs.
The Chip Insider® Strategy & Tactics Strategy and Tactics: Manic-Depressive Forces Shaping Semiconductors. Summaries: Chip History — Excyte’s 100 year history: I recently read the 100th Anniversary book of the M+W Group. What was so amazing was how they successively pivoted at so many junctures across this history… The Bipolar Years: 2020 to 2021, the Manic-Depressive Forces Shaping the Semiconductor Equipment Industry. You are not alone. Feel confounded about what the second half of 2020 and 2021 will look like? What continues to make these times so difficult to understand is the manic-depressive nature of so many drivers … Most of which are out-of-sample blasts that have never been seen before. The COVID Crisis is the most obvious one as well as the wild swings in the stock market. As the crisis played out … governments … around the globe moved to stay-in-place, effectively shutting down their economies. Then they and their governments quickly responded with massive stimulus programs. They flooded the economy with unprecedented levels money via loans. Back in 1998, during the Asian Financial Crisis they would come to call this the “Greenspan Put,” which pales in comparison to the Powell Put we are seeing this year. The big question as to how this will play is not if there is enough money. It is, will all this money have a classical stimulus effect, because … Important ChipChirps™ Facts from the Far Side ChipChirps™ are short notifications from VLSI’s analysts to alert clients about breaking news and events. They are exclusively available on VLSI’s App for Android and iOS. “What you do in life echoes in eternity” — From the Movie “The Gladiator” Contact us to get the full report and more VLSIresearch … intelligence to make better decisions faster Copyright © 2020 VLSI Research Inc. All rights reserved. Distribution rights contained in T&Cs.
semiStockWEEK: VLSI's Semiconductor Stock Indices and the market rose this week. EDA stock index hit a fresh new yearly high. Semiconductors +3%, Equipment +5%, EDA +3%, Electronic Materials +1%. VLSIresearch … intelligence to make better decisions faster Copyright © 2020 VLSI Research Inc. All rights reserved. Distribution rights contained in T&Cs.
Semiconductor Stocks: Weekly Growth and Forward P/E Ratios by Company VLSI’s Semiconductor Stock Index was led up 2.6% by SMIC and MediaTek. IDM +2.3% Foundry & OSAT +2.6% Fabless & Fablite +2.5% Weekly Gains 6/19/2020 Price Change Price Change Forward P/E Forward P/E Semiconductor Stocks Semiconductor Stocks IDM Fab-lite to Fabless Intel Micron 0.5% 4.4% 12 11 AMD Analog Devices 1.4% 1.5% 36 24 ON Semiconductor Samsung Electronics SK hynix STMicroelectronics 2.1% 1.1% 0.2% 4.3% 16 – Broadcom IBM Infineon MagnaChip Semiconductor 0.8% 0.5% 2.5% -2.2% 13 10 20 14 AMD AMDAnalog Devices ADIAmkorAMKR ASE ASXBroadcom AVGOIBMIBM Infineon IFNNY.PK Intel INTCJCET600584.SS Kingpak Technology6238.TWO Micron Technology MU On Semiconductor ONPanasonic PC MagnaChip Semiconductor MXMaxim MXIM MaxLinear MXLMediaTek 2454.TW NVIDIA NVDAQualcomm QCOM Samsung Electronics 005930.KS Silicon Laboratories SLABSkyworks SWKS SMIC SMI STMicroelectronics STM Texas Instruments TXNTSMC TSMUMC UMCWestern Digital WDCXilinx XLNX 21 Western Digital Foundry & OSAT Amkor 7 Maxim MaxLinear MediaTek 28 27 – 3.4% 5.8% 2.8% 10.9% 0.3% 15 ASE JCET Kingpak Technology SMIC TSMC UMC 0.2% 2.8% 0.0% 18.2% -1.3% -2.3% 11 89 – NVIDIA Panasonic Qualcomm Silicon Laboratories Skyworks Texas Instruments 37 11 15 30 19 25 3.7% 1.0% 4.2% 1.3% 0.3% 0.7% 2290 18 13 Xilinx 28 5.3% VLSIresearch … intelligence to make better decisions faster Copyright © 2020 VLSI Research Inc. All rights reserved. Distribution rights contained in T&Cs.
Chip Equipment & Related Stocks: Weekly Growth and Forward P/E Ratios by Company VLSI’s Semiconductor Equipment Stock Index was led up 5.3% by FormFactor, Teradyne, ASM Pacific Technology, and Lam Research. WFE +5.0% Test +11.8% Assembly +3.7% Weekly Gains 0 6/19/2020 Price Change Price Change Forward P/E Forward P/E Equipment Stocks Equipment Stocks Wafer Process: Test: Applied Materials ASM International 14 19 Advantest Teradyne 2.9% 15.3% 7.8% 2.5% – 23 ASML KLA Lam Research Onto Innovation Nikon TEL Veeco Instruments 32 19 18 – – – 14 FormFactor 24 5.1% 4.6% 10.8% 1.2% 0.6% 7.3% 5.2% 17.1% Applied Materials AMAT Advantest ATEYY ASM International ASMI ASM Lithography ASML ASM Pacific 0522.HK BE Semiconductor BESIY.PK FormFactorFORMKLA KLAC Kulicke & Soffa KLIC Lam Research LRCX Onto Innovation ONTONikon 7731 Teradyne TER Tokyo Electron Limited 8035 Veeco VECO Assembly: BESI Kulicke & Soffa ASM Pacific Technology -5.1% 2.7% 13.6% – 14 VLSIresearch … intelligence to make better decisions faster Copyright © 2020 VLSI Research Inc. All rights reserved. Distribution rights contained in T&Cs.
Electronic Materials Stocks: Weekly Growth and Forward P/E Ratios by Company Weekly Gains EDA & Electronic Materials Stocks EDA Cadence Synopsys Electronic Materials BASF Cabot Microelectronics 6/19/2020 VLSI’s EDA Stock Index jumped 2.7% to a new yearly high. Price Change Price Change -1.7% 3.2% 3.0% -0.4% -0.9% 2.6% EDA & Electronic Materials Stocks DNP DuPont de Nemours JSR Shin-Etsu SOITEC Tokyo Ohka Forward P/E Forward P/E VLSI’s Electronics Materials Stock Index was led up 0.5% by DuPont de Nemours. – 3 – – – – 2.7% 2.7% 34 31 BASF BASFY Cadence CNDS DNP 7912 JSR 4185 SOI.PA Synopsys SNPS Cabot Microelectronics CCMP DuPont DD Shin-Etsu 4063 SOITEC Tokyo Ohka 4186 -2.4% 0.9% 2 20 VLSIresearch … intelligence to make better decisions faster Copyright © 2020 VLSI Research Inc. All rights reserved. Distribution rights contained in T&Cs.
Companies Companies Max Growth Weekly Growth VLSI’s Indices of Chip Industry Stocks Min Growth Range of S&P 500 S&P 500 The Prior Week's Close Growth Growth Down Up Semi Stocks Equipment Stocks Materials Stocks EDA Stocks Semi Stocks Equipment Stocks Materials Stocks EDA Stocks 15-Nov-19 22-Nov-19 29-Nov-19 06-Dec-19 13-Dec-19 20-Dec-19 27-Dec-19 03-Jan-20 10-Jan-20 17-Jan-20 24-Jan-20 31-Jan-20 07-Feb-20 14-Feb-20 21-Feb-20 28-Feb-20 06-Mar-20 13-Mar-20 20-Mar-20 27-Mar-20 03-Apr-20 10-Apr-20 17-Apr-20 24-Apr-20 01-May-20 08-May-20 15-May-20 22-May-20 29-May-20 05-Jun-20 12-Jun-20 19-Jun-20 92.0 90.0 90.9 92.6 96.7 99.2 100.0 100.3 101.5 104.7 106.1 98.4 102.5 106.5 103.7 93.1 91.8 81.1 69.6 78.3 77.1 85.6 89.1 88.7 89.1 94.8 91.4 95.1 97.4 106.2 100.7 103.3 97.0 92.0 93.7 94.7 98.0 99.9 100.0 100.2 100.9 104.8 105.1 98.4 101.3 106.6 99.3 90.4 91.0 78.3 65.2 78.7 73.4 84.0 88.4 86.1 83.9 91.9 87.1 89.8 91.0 101.6 96.7 101.8 97.6 95.9 100.1 95.5 96.9 99.6 100.0 100.5 104.7 106.4 107.8 103.8 107.2 114.2 106.4 96.2 95.1 90.7 78.4 88.7 89.9 99.7 111.3 111.9 107.5 115.9 115.1 122.3 129.5 130.3 127.8 131.2 0.4% -2.2% 1.0% 1.8% 4.5% 2.6% 0.8% 0.3% 1.2% 3.2% 1.3% -7.3% 4.2% 3.9% -2.6% -10.2% -1.5% -11.6% -14.2% 12.6% -1.6% 11.1% 4.0% -0.4% 0.5% 6.4% -3.6% 4.0% 2.4% 9.0% -5.2% 2.6% 2.1% -5.1% 1.8% 1.1% 3.5% 1.9% 0.1% 0.2% 0.7% 3.9% 0.3% -6.3% 2.9% 5.3% -6.9% -8.9% 0.6% -13.9% -16.7% 20.6% -6.7% 14.5% 5.2% -2.6% -2.6% 9.6% -5.3% 3.1% 1.4% 11.6% -4.8% 5.3% -1.6% -2.8% -2.0% -1.2% 4.7% 0.1% -0.1% -1.1% 0.2% 1.8% -0.5% -4.5% 4.6% 0.6% -2.8% -12.9% -0.7% -16.3% -5.7% 14.4% -5.3% 13.8% 0.2% -0.2% 3.1% 3.9% -1.8% 3.3% 5.8% 5.5% -4.4% 0.5% 1.6% -1.8% 4.4% -4.6% 1.5% 2.7% 0.4% 0.5% 4.2% 1.7% 1.3% -3.8% 3.3% 6.5% -6.9% -9.5% -1.2% -4.6% -13.6% 13.1% 1.4% 10.9% 11.7% 0.6% -4.0% 7.8% -0.7% 6.3% 5.9% 0.6% -2.0% 2.7% 31 7 37 33 48 39 29 23 32 45 29 3 45 47 6 0 18 0 3 52 14 54 41 17 27 52 10 42 43 50 6 46 10.8% 5.7% 5.0% 8.2% 10.7% 12.5% 5.9% 9.5% 7.2% 19.1% 14.9% 2.2% 21.4% 27.5% 4.5% -0.8% 7.9% -2.1% 15.3% 36.1% 17.4% 38.2% 17.0% 9.2% 19.1% 31.0% 16.8% 13.5% 14.6% 22.6% 1.4% 18.2% -20 -44 -14 -19 -3 -13 -23 -24 -22 -10 -25 -51 -10 -8 -49 -55 -35 -55 -52 -3 -41 -1 -10 -37 -28 -3 -45 -12 -12 -4 -47 -8 -5.0% -17.7% -15.0% -4.8% -1.4% -8.4% 2.7% -3.4% -4.8% -3.8% -10.8% -17.7% -11.7% -10.0% -17.1% -21.3% -11.0% -26.6% -28.9% -11.7% -15.1% -2.3% -6.1% -9.8% -11.9% -2.4% -21.1% -11.7% -3.2% -3.6% -13.3% -5.1% 15.8% 23.4% 20.0% 13.0% 12.1% 20.9% 8.6% 12.9% 12.0% 22.9% 25.7% 19.9% 33.1% 37.5% 21.6% 20.5% 18.9% 24.5% 44.2% 47.8% 32.5% 40.5% 23.1% 19.0% 31.0% 33.4% 37.9% 25.2% 17.8% 26.2% 14.7% 23.3% 96.3 96.0 96.9 97.1 97.8 99.4 100.0 99.8 100.8 102.8 101.7 99.5 102.7 104.3 103.0 91.2 91.7 83.7 71.1 78.4 76.8 86.1 88.7 87.6 87.4 90.4 88.4 91.2 94.0 98.6 93.9 95.6 0.9% -0.3% 1.0% 0.2% 0.7% 1.7% 0.6% -0.2% 0.9% 2.0% -1.0% -2.1% 3.2% 1.6% -1.3% -11.5% 0.6% -8.8% -15.0% 10.3% -2.1% 12.1% 3.0% -1.3% -0.2% 3.5% -2.3% 3.2% 3.0% 4.9% -4.8% 1.9% 101.5 98.7 96.7 95.5 100.0 100.1 100.0 98.9 99.2 101.0 100.5 96.0 100.4 101.0 98.1 85.5 84.8 71.0 67.0 76.6 72.6 82.6 82.7 82.5 85.0 88.4 86.8 89.7 94.9 100.1 95.7 96.2 VLSIresearch … intelligence to make better decisions faster Copyright © 2020 VLSI Research Inc. All rights reserved. Distribution rights contained in T&Cs.