Download
1 / 17
200 likes | 409 Vues
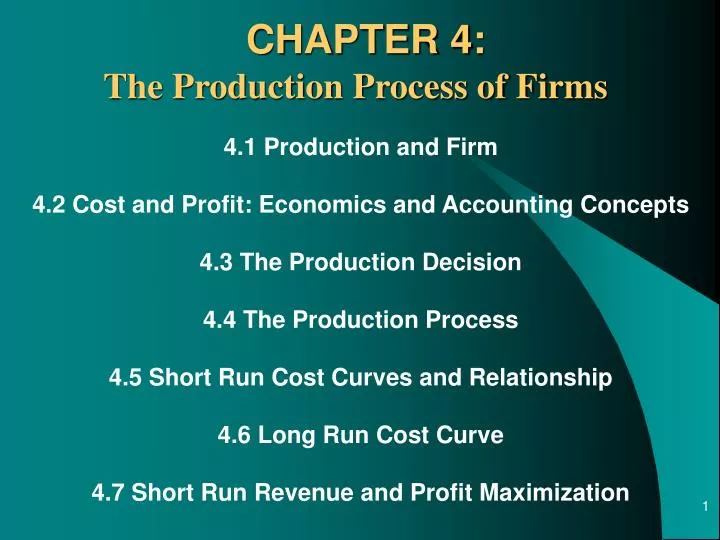
CHAPTER 4:. The Production Process of Firms. 4.1 Production and Firm 4.2 Cost and Profit: Economics and Accounting Concepts 4.3 The Production Decision 4.4 The Production Process 4.5 Short Run Cost Curves and Relationship 4.6 Long Run Cost Curve

E N D
CHAPTER 4: The Production Process of Firms 4.1 Production and Firm 4.2 Cost and Profit: Economics and Accounting Concepts 4.3 The Production Decision 4.4 The Production Process 4.5 Short Run Cost Curves and Relationship 4.6 Long Run Cost Curve 4.7 Short Run Revenue and Profit Maximization
4.1 Production and Firm Production process: i. The process by which inputs are combined, transformed, and turned into outputs ii. Usually, by firm Firm: i. An output producing organization ii. Demand production factors from input market iii. Maximize profit (rational assumption)
4.2 Cost & Profit: Economics & Accounting Concepts Accounting Cost: i. Considered as “normal” cost (or profit) ii. What was paid out (in money) iii. Considered as explicit cost iv. E.g. wages or rental Economics Cost: i. Reflex the opportunity cost ii. The 2nd best alternative lost iii. Considered as implicit cost iv. E.g. Owner time/effort or using own building
4.4 The Production Process Input decision: >>How many >>Which types Cost decision Selling price Input: Capital Input: Labour Output Input: Raw Material Technology q = f(K, L, M…)
4.4 Production Process Terms: a) Marginal Product (MP): i. additional output that can be produced by adding one more unit of a particular input ii. MP slopping down reflex the law of diminishing marginal returns The law of diminishing marginal returns states that when additional units of a variable input are added to fixed inputs, the marginal product of the variable input declines. b) Average Product of labour (AP): i. average amount produced by each unit of a variable factor (e.g labour) ii. Total product / Units of Labour
4.4 Production Process Relationship between TP, AP & MP • MPis the slope of the total product function (dTP/dL). AP is the slope of the line from origin. • At point B, the slope of the total product function is highest; thus, average product is highest (and AP = MP). • At point C, total product is maximum, the slope of the total product function is zero, and marginal product intersects the horizontal axis. Additional labour didn’t yield additional output. • When marginal product falls below the horizontal axis (negative marginal product), total product decline.
4.4 Production Process Relationship between TP, AP & MP • When average product is maximum, average product and marginal product are equal. • As long as marginal product rises, average product rises. • When average product falls; marginal product is less than average product.
4.5 Short Run Cost Curve & Relationship Types of cost: a) Fixed cost (FC): i. Costs that incurred even if the firm is producing nothing ii. No fixed cost in long run iii. Sunk cost is a type of fixed cost (but not recoverable) b) Variable cost (VC): i. Costs associated with input (e.g. labour) ii. Depend on production iii. VC = VC (q) c) Total cost (TC): i. Sum of fixed and variable costs ii. TC = TFC + TVC
4.5 Short Run Cost d) Average cost (AC): i. Total cost / output >>> AC = TC / q ii. Total cost per unit e) Marginal cost (MC): i. MC = ΔTC / Δq ii. Additional cost of producing one more unit of output f) Average fixed cost (AFC): i. AFC = TFC / q ii. When output increase, FC constant, AFC decline g) Average variable cost (AVC): i. AVC = TVC / q
4.5 Short Run Cost Relationship between TVC, AVC & MC • Total variable cost (TVC) always increases with output . • The marginal cost (MC) curve shows how total variable cost changes. • When MC is below average variable cost, AVC is declining.When MC is above AVC, AVC is increasing. • MC intersects AVC at the lowest, or minimum, point of AVC .
4.6 Long Run Cost Curve >> No fix scale of operation << Larger scale? Smaller scale? Economies of scale? Reduce production cost Diseconomies of scale? Growth constraint Constant return to scale? Reflect in the firm’s long run average cost (LRAC) shape Effect on average cost
4.6 Long Run Cost Curve LRAC for Economies of Scale >> Also called “increasing returns to scale” >> LRAC downward slopping
4.6 Long Run Cost Curve LRAC for Diseconomies of Scale Diseconomies of Scale >> Also called “decreasing returns to scale” >> LRAC become upward slopping >> optimal scale = minimum LRAC = q*
Input decision: >>How many >>Which types Cost decision Selling price Input: Capital Input: Labour Output Input: Raw Material Technology 4.7 Short Run Revenue & Profit Maximization Refresh ……. (TP, AP & MP) (TC, TVC, TFC, AVC & MC) (TR & MR)
4.7 SR Rev & Profit Max Types of revenue: a) Total revenue (TR): i. The total amount that a firm takes in from the sale of its output ii. TR = p*q b) Average total revenue (ATR): i. The amount that a firm received from the sales of each units of output ii. ATR = TR / q c) Marginal revenue (MR): i. Additional revenue that a firm takes in when it increases output by one additional unit ii. MR = ∆TR/∆q iii. For perfect competition, MR = (p∆q) / ∆q = p
4.7 SR Rev & Profit Max Profit Maximization: a) Profit ( π ): i. Difference between total revenue and total economic cost ii. π = TR – TC iii. Total economic cost reflects a normal rate of return (rate that is just sufficient to keep current investors interested in the industry) b) Breakeven: i. π = 0 >> TR = normal rate of return >> normal profit c) Profit maximization: i. π = TR – TC the largest ii. When MC = MR
(1) Output (q) (unit) (2) TFC (RM) (3) TVC (RM) (4) MC (RM) (5) P = MR (RM) (6) TR (p*q) (RM) (7) TC (TFC + TVC) (RM) (8) PROFIT (TR – TC) (RM) 0 10 0 - 15 0 10 (10) 1 10 10 10 15 15 20 (5) 2 10 15 5 15 30 25 5 3 10 20 5 15 45 30 15 4 10 35 15 15 60 45 15 5 10 55 20 15 75 65 10 6 10 80 25 15 90 90 0 Cost, Revenues & Profit Calculation MC = MR End