Download
1 / 43
430 likes | 458 Vues
Learn about normalization processes to reduce data redundancies, eliminate anomalies, and create efficient database designs. Understand top-down vs. bottom-up approaches and steps involved in achieving normalization.

E N D
Agenda • Top Down vs Bottom Up • What is Normalization? • Why Normalization? • Normalization Steps
Top Down vs Bottom Up • Top Down • Usually provided just a narrative or very high level data requirements • Need to discover entities, attributes, relationships • Result is tables
Top Down vs Bottom Up • Bottom Up • Provided with views of data • Views can be screen shots or reports (printouts) • Views contain fields (data) • Need to groups fields together – find fields that are in common • Result is tables
Agenda • Top Down vs Bottom Up • What is Normalization? • Why Normalization? • Normalization Steps
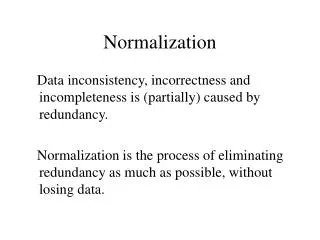
What is normalization? • Normalization • Process for evaluating and correcting table structures to minimize data redundancies • helps eliminate data anomalies • Can be used in conjunction with ER modeling to produce a good database design
What is normalization? • Works through a series of stages called normal forms: • Normal form (1NF) • Second normal form (2NF) • Third normal form (3NF)
What is normalization? • 2NF is better than 1NF • 3NF is better than 2NF • For most business database design purposes, 3NF is highest we need to go in the normalization process • Highest level of normalization is not always most desirable
Agenda • Top Down vs Bottom Up • What is Normalization? • Why Normalization? • Normalization Steps
Why normalization? • Example: company that manages building projects • Charges its clients by billing hours spent on each contract • Hourly billing rate is dependent on employee’s position • Periodically, a report is generated that contains information displayed as in Table 5.1
Why normalization? • Structure of data set in Figure 5.1 does not handle data very well • The table structure appears to work; report is generated with ease • Unfortunately, the report may yield different results, depending on what data anomaly has occurred
Agenda • Top Down vs Bottom Up • What is Normalization? • Why Normalization? • Normalization Steps
Conversion to First Normal Form • Relational table must not contain repeating groups • Repeating group • Derives its name from the fact that a group of multiple (related) entries can exist for any single key attribute occurrence • Normalizing the table structure will reduce these data redundancies • Normalization is three-step procedure
Step 1: Eliminate the Repeating Groups • Present data in a tabular format, where each cell has a single value and there are no repeating groups • Eliminate repeating groups by eliminating nulls, making sure that each repeating group attribute contains an appropriate data value
Step 2: Identify the Primary Key • Primary key must uniquely identify attribute values (a row) • Primary key is PROJ_NUM, EMP_NUM (because the combination of those two uniquely identifies each row of the table)
Step 3: Identify all Dependencies • Dependencies can be depicted with the help of a diagram • Dependency diagram: • Depicts all dependencies found within a given table structure • Helpful in getting bird’s-eye view of all relationships among a table’s attributes • Use makes it much less likely that an important dependency will be overlooked
Dependency Diagram 1NF PROJ_NUM PROJ_NAME EMP_NUM EMP_NAME JOB_CLASS CHG_HOUR HOURS
First Normal Form • Tabular format in which: • All key attributes are defined • There are no repeating groups in the table • All attributes are dependent on primary key • All relational tables satisfy 1NF requirements • Some tables contain partial dependencies • Dependencies based on only part of the primary key • Still subject to data redundancies EMPLOYEE_PROJECT(PROJ_NUM(PK), EMP_NUM(PK), PROJ_NAME, EMP_NAME, JOB_CLASS, CHG_HOUR, HOURS)
Conversion to Second Normal Form • Relational database design can be improved by converting the database into second normal form (2NF) • Two steps
Step 1: Identify All Key Components • Determine which attributes are dependent on which other attributes • Using the dependency diagram, document the partial dependencies: in other words take each part of the primary key and document which attributes are dependent on each part of the primary key
Dependency Diagram 2NF 1NF PROJ_NUM PROJ_NAME EMP_NUM EMP_NAME JOB_CLASS CHG_HOUR HOURS
Step 2: Identify the Dependent Attributes • Write each key component on separate line, and then write the original (composite) key on the last line • Each component will become the key in a new table PROJECT (PROJ_NUM (PK), PROJ_NAME) EMPLOYEE (EMP_NUM(PK), EMP_NAME, JOB_CLASS, CHG_HOUR) EMPLOYEE_PROJECT(PROJ_NUM(PK), EMP_NUM(PK), HOURS)
Second Normal Form • Table is in second normal form (2NF) if: • It is in 1NF and • It includes no partial dependencies: • No attribute is dependent on only a portion of the primary key
Conversion to Third Normal Form • Data anomalies created are easily eliminated by completing these steps
Step 1: Identify Each New Determinant • For every transitive dependency, write its determinant as a PK for a new table • Determinant • Any attribute whose value determines other values within a row • Using the dependency diagram, document the transitive dependencies: in other words identify the attributes dependent on each determinant identified above and identify the dependency
Dependency Diagram 3 NF 2NF 1NF PROJ_NUM PROJ_NAME EMP_NUM EMP_NAME JOB_CLASS CHG_HOUR HOURS JOB_CLASS is a determinant because it can determine other values within the row. In this case, it’s the CHG_HOUR
Step 2: Name the table • Name the table to reflect its contents and function PROJECT (PROJ_NUM (PK), PROJ_NAME) EMPLOYEE (EMP_NUM(PK), EMP_NAME) JOB (JOB_CLASS(PK), CHG_HOUR) EMPLOYEE_PROJECT(PROJ_NUM(PK), EMP_NUM(PK), HOURS)
Third Normal Form • A table is in third normal form (3NF)if: • It is in 2NF and • It contains no transitive dependencies
Improving the Design • Table structures are cleaned up to eliminate the troublesome initial partial and transitive dependencies • Normalization cannot, by itself, be relied on to make good designs • It is valuable because its use helps eliminate data redundancies
Improving the Design (continued) • The following changes should be made: • PK assignment • Naming conventions • Attribute atomicity • Adding attributes • Adding relationships (will define the FKs) • Refining PKs • Eliminate derived attributes
Business Rules • Business Rules drive the relationships • Look at the data in the table and understand/interpret what the relationship is between the data
Business Rules • A job class can have more than 1 employee in it; results in a 1:M relationships between JOB and EMPLOYEE • Add the FKs into the appropriate tables
Step 2: Name the table • Name the table to reflect its contents and function PROJECT (PROJ_NUM (PK), PROJ_NAME) EMPLOYEE (EMP_NUM(PK), EMP_NAME, JOB_CLASS(FK)) JOB (JOB_CLASS(PK), CHG_HOUR) EMPLOYEE_PROJECT(PROJ_NUM(PK), EMP_NUM(PK), HOURS) New foreign key Business rule not necessary between EMPLOYEE and PROJECT. Why?
Normalization and Database Design • Normalization should be part of design process • Make sure that proposed entities meet required normal form before table structures are created • ER diagram • Provides the big picture, or macro view, of an organization’s data requirements and operations • Created through an iterative process • Identifying relevant entities, their attributes and their relationship • Use results to identify additional entities and attributes
Normalization and Database Design (continued) • Normalization procedures • Focus on the characteristics of specific entities • A micro view of the entities within the ER diagram • Difficult to separate normalization process from ER modeling process • Two techniques should be used concurrently
Summary • Normalization is a table design technique aimed at minimizing data redundancies • First three normal forms (1NF, 2NF, and 3NF) are most commonly encountered • Normalization is an important part—but only a part—of the design process • Continue the iterative ER process until all entities and their attributes are defined and all equivalent tables are in 3NF
Normalization Exercise Normalize the above table. 1NF – eliminate repeating groups, identify a PK for the table structure 2NF – find partial dependencies 3NF - find transitive dependencies Write final table structures, including all relationships. Make all attributes atomic.
Normalization Exercise Normalize the above table. 1NF – eliminate repeating groups, identify a PK for the table structure 2NF – find partial dependencies 3NF - find transitive dependencies Write final table structures, including all relationships. Make all attributes atomic.