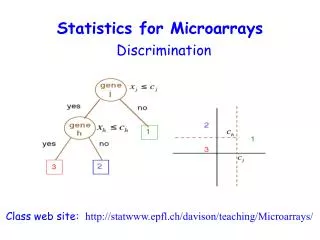
Normalization For MicroArrays
This tutorial by David Hoyle from the University of Manchester provides an in-depth overview of normalization techniques in microarray analysis. It explains the necessity of normalization to eliminate systematic biases resulting from sample preparation, hybridization variability, spatial effects, scanner settings, and experimenter bias. The tutorial covers various methods and algorithms, detailing their application in data analysis, including clustering and genetic network discovery. Key topics include mean and median centering, scale transformations, and regression methods, all essential for accurate comparison across experiments.

Normalization For MicroArrays
E N D
Presentation Transcript
Normalization For MicroArrays A Tutorial Introduction David Hoyle University of Manchester http://www.bioinf.man.ac.uk/microarray
Why Normalization ? To remove systematic biases, which include, • Sample preparation • Variability in hybridization • Spatial effects • Scanner settings • Experimenter bias
What Normalization Is & What It Isn’t • Methods and Algorithms • Applied after some Image Analysis • Applied before subsequent Data Analysis • Allows comparison of experiments • Not a cure for poor data.
Sample Preparation Scanning + Image Analysis Hybridization Normalization Data Analysis Array Fabrication Where Normalization Fits In Normalization Subsequent analysis, e.g clustering, uncovering genetic networks Spot location, assignment of intensities, background correction etc.
Choice of Probe Set • House keeping genes – e.g. Actin, GAPDH • Larger subsets – Rank invariant sets Schadt et al (2001) J. Cellular Biochemistry37 • Spiked in Controls • Chip wide normalization – all spots Normalization method intricately linked to choice of probes used to perform normalization
Form of Data Working with logged values gives symmetric distribution Global factors such as total mRNA loading and effect of PMT settings easily eliminated.
Mean & Median Centering • Simplist Normalization Procedure • Assume No overall change in D.E. Mean log (mRNA ratio) is same between experiments. • Spot intensity ratios not perfect log(ratio) log(ratio) – mean(log ratio) or log(ratio) log(ratio) – median(log ratio) more robust
0 0 Location & Scale Transformations Mean & Median centering are examples of location transformations
0 0 Location & Scale Transformations Scale Transformation = Multiply all values by a constant Scale transformations can also be applied where scale of experiments is believed to be comparable.This may or may not make biological sense
Regression Methods • Compare two hybridizations (exp. and ref) – use scatter plot • If perfect comparability – straight line through 0, slope 1 • Normalization – fit straight line and adjust to 0 intercept and slope 1 • Various robust procedures exist
log R M log G A M = log R – log G A = ½[ log R + log G ] M = Minus A = Add M-A Plots M-A plot is 45° rotation of standard scatter plot 45°
M M A A M-A Plots Un-normalized Normalized Normalized M values are just heights between spots and the “general trend” (red line)
Methods To Determine General Trend • Lowess (loess) Y.H. Yang et al, Nucl. Acid. Res. 30 (2002) • Local Average • Global Non-linear Parametric Fit e.g. Polynomials • Standard Orthogonal decompositions e.g. Fourier Transforms • Non-orthogonal decompositions e.g. Wavelets
Lowess Gasch et al. (2000) Mol. Biol. Cell 11, 4241-4257
M A Lowess Demo 1
M A Lowess Demo 2
M A Lowess Demo 3
M A Lowess Demo 4
M A Lowess Demo 5
M A Lowess Demo 6
M A Lowess Demo 7
M A Lowess Demo 8 Kernel Too Narrow
M A Lowess Demo 9 Kernel Too Wide
M A Lowess Demo 10 Span f Span f 20% – 40%
Things You Can Do With Lowess (and other methods) Bias from different sources can be corrected sometimes by using independent variable. • Correct bias in MA plot for each print-tip • Correct bias in MA plot for each sector • Correct bias due to spatial position on chip
Print Tip Normalization S. Dudoit et al (2002), Statistica Sinica12, 111-139
Pros & Cons of Lowess • No assumption of mathematical form – flexible • Easy to use • Slow - unless equivalent kernel pre-calculated • Too flexible ? Parametric forms just as good and faster to fit.
Paired Slide Normalization (Large Differential Expression) M, A from one hybridization M’, A’ from dye swap M’ -M, A’ A , but bias is intensity dependent same for A & A’ ½[M-M’] good normalized value at ½[A+A’]
Paired Slide Normalization(General) • Paired Slide Normalization valid even if D.E. is not large • Reproducibility is greatest when using self-normalization using paired slides Dr. YongXiang Fang – unpublished • Dye swaps a good idea if you can afford them.