Comparison of De Bruijn Graph and Overlay Graph Assemblers for NGS Sequencing
This presentation explores sequencing methods, focusing on an experimental comparison between De Bruijn graph and overlay graph assemblers. We discuss preliminary results derived from lab exercises that utilize both Sanger sequencing and second-generation sequencing workflows, including platforms like Illumina and 454. The performance metrics evaluated include read length, accuracy, and memory usage. The differences in computational efficiency and suitability for various read lengths are highlighted, along with recommendations based on our findings and simulated data sets from multiple genomes.

Comparison of De Bruijn Graph and Overlay Graph Assemblers for NGS Sequencing
E N D
Presentation Transcript
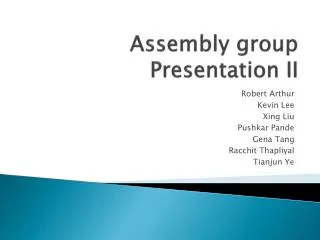
Assembly Group Presentation II Robert Arthur Kevin Lee Xing Liu Pushkar Pande Gena Tang Racchit Thapliyal Tianjun Ye
Presentation Overview • Sequencing Methods • Experimental comparison of De Bruijn graph and Overlay graph assemblers • Preliminary Results • Lab Exercise
Sequencing Methods • Sanger Sequencing • Cycle sequencing rxn • ddNTP-terminated dye-labeled products • High-resolution electrophoretic separation • Parallelized in 96 or 384 capillaries • Read lengths up to 1kBp • Raw accuracy up to 99.999% • Costs 50 ¢ per kB
Sequencing Methods • Second Gen. Sequencing • Cyclical array methods • 454 • Illumina • AB SOLiD • Polonator • HeliScope • Platforms vary in biochemistry and array generation yet conceptually similar in workflow
454 Pyrosequencing • Create a DNA library • Ligate adaptors to fragments • Emulsion PCR • Agarose beads • Oil, water, PCR reagents • Results in 1 mill copies / fragment for each bead
More 454 • Beads arrayed into picotiter plate • Immobilized via addition of enzyme containing beads • Each cell contains exactly 1 bead • Bst polymerase, luciferase, apyrase, ATP sulferylase used
4-mer 3-mer Measures the presence or absence of each nucleotide at any given position TACG Flow Order 2-mer KEY (TCAG) 1-mer Even more 454Example of Output
Presentation overview • Sequencing Methods • Experimental comparison of De Bruijn graph and Overlay graph assemblers • Preliminary Results • Lab Exercise
De Bruijn Graph assemblers and Overlay Graph assemblers • De Bruijn Graph assemblers • Velvet, Abyss, Euler • Overlay Graph assemblers • Newbler, Edena, SSAKE, VCAKE
Synthetic Data used for Experiments • Write a C program to simulate reads from reference genome with specific read length, coverage and base error rate • Human chr 22, ~33.5M bases • Streptococcus Suis, NC_012925.1, ~2M bases • Helicobacter acinonychis Sheeba, ~ 1.5M bases • Write anther C program to measure the quality of assemblers • N50 length • No. of contigs • Max contig length • No. of mis-assembled contigs
Read Length • De Bruijn graph assemblers are only suitable for short reads data • K limitation • Use Hash table or Sorting to index K-mers • Need use a unique key(value) to represent each K-mer • K=16 416=232 <-> 32-bit integer (unsigned int) • K=32 432=264 <-> 64-bit integer (unsigned long long) • K>32? <-> multiple integer to represent the hash table key
Simulate reads from Streptococcus Suis • 300 read length, 50X coverage, error rate 0.1% • Velvet default: K <= 31, so we use 31 • Recompile velvet, K = 99
Quality and Accuracy • It is stated in some literatures that “De Bruijn based approach prone to false positives”, “Overlap graph has better quality”
Simulate reads from Helicobacter acinonychisSheeba • 35 read length, 50X coverage, error rate 0.1%
Simulate reads from Streptococcus Suis • 35 read length, 50X coverage, error rate 0.1%
Runtime and Memory Usage • Overlap graph based assemblers are computing-expensive and use more memory • All-to-all alignment of reads, O(n2) • Use more memory to store overlap graph • Typically, number of reads is weigh larger than the number of K-mers • Especially for short reads data • With the same coverage and genome length, shorter reads means more reads • It is stated that De Bruijn graph are more suitable for NGS data • Shorter reads, and high throughput
Simulate reads from Streptococcus Suis • 802995 reads • 50 read length, 20X coverage, error rate 0.1% • Xeon E5530 2.4 GHz
However! • Recent advance of pattern matching algorithms and technical enable the use of overlap graph • Suffix tree, Suffix array, Prefix array, compressed suffix array • Suffix array • Be able to find overlap between reads in linear time • Usage of compressed suffix array can significantly reduce the memory requirements of overlap graph assemblers • Examples • D. Hernandez, P. François, L. Farinelli, M. Osteras, and J. Schrenzel , De novo bacterial genome sequencing: millions of very short reads assembled on a desktop computer. Genome Research. 18:802-809, 2008. • Jared T. Simpson and Richard Durbin Efficient construction of an assembly string graph using the FM-index, Bioinformatics (2010) 26 (12):i367-i373. • Pasqual • Pushkar and I have developed a parallel sequence assembler based on overlap graph in our research project
Simulate reads from Human chr22 • 6978908 reads • 50 read length, 20X coverage, error rate 0.1% • Xeon E5530 2.4 GHz with 4 cores/8 threads
Mixed Length Reads • H. influenzae • 30 ~ 300 length • Velvet does not work • K is fixed • If we use big K, the reads shorter than K can not be assembled. • If we use small K, it is difficult to assemble the long reads • Overlap graph assemblers do not have this issue • Newbler
Conclusion • Controversial • It is still unclear about the relation between De Bruijn graph and Overlap graph • We can still conclude from the experiments • Regarding quality and accuracy, Overlap graph assemblers are thought to be better than De Bruijn graph assembler • De Bruijn graph assemblers does not work for long reads • De Bruijn graph assemblers does not work for mixed length reads (K is fixed) • Traditional overlap graph assemblers are slower and use more memory, but latest assemblers are better than De Bruijn graph assemblers
Presentation overview • Sequencing Methods • Experimental comparison of De Bruijn graph and Overlay graph assemblers • Preliminary Results • Lab Exercise
Velvet Input: Fasta/Fastq Output: Fasta $> velveth <output_dir> <k-mer length> -fasta -long <reads.fasta> $> velvetg <output_dir>
WGS assembler (Celera) • >50 separate programs make up the Celera Assembler pipeline • runCA script helps manage them all Input: frg format Output: Fasta $> sffToCA –trim soft –libraryname${Id}-trimsoft –output ${Id}-trimsoft${Id}.sff $> runCA –p ${Id} –d ${Id}ovlConcurrency=4 ${id}-trimsoft.frg
Newbler Input: .sff Output: Fasta $> runAssembly <reads.sff> // de novo assembly
MIRA MIRA stands for Mimicking Intelligent Read Assembly Input: Fasta + qual + trace info Output: Fasta, Ace $> sff_extract –s ${Id}_in.454.fasta -q ${Id}_in.454.fasta.qual -x ${Id}_traceinfo_in.454.xml ${Id}.sff $> mira --project=${Id} --job=denovo,genome,normal,454 -GE:not=4 >& ${Id}_assembly.log
Works Cited • “Next-generation DNA sequencing” Shendure et. al, http://compgenomics2011.biology.gatech.edu/images/f/f9/Shendure-NatureBiotechnology-2008.pdf • “Next-generation DNA sequencing methods” Mardis et. al, http://compgenomics2011.biology.gatech.edu/images/5/59/Mardis-AnnuRevGenet-2008.pdf
Presentation overview • Sequencing Methods • Experimental comparison of De Bruijn graph and Overlay graph assemblers • Preliminary Results • Lab Exercise
Lab Exercise • Download the Lab Exercise file from the Genome Assembly wiki page