Download
1 / 34
340 likes | 356 Vues
Join the Cycling Club serving Southern Oregon & Northern California since 1986. Our non-profit organization promotes cycling safety, offers weekly rides, and hosts fun events like Ice Cream Socials and BBQs. Become a member for only $20 annually!

E N D
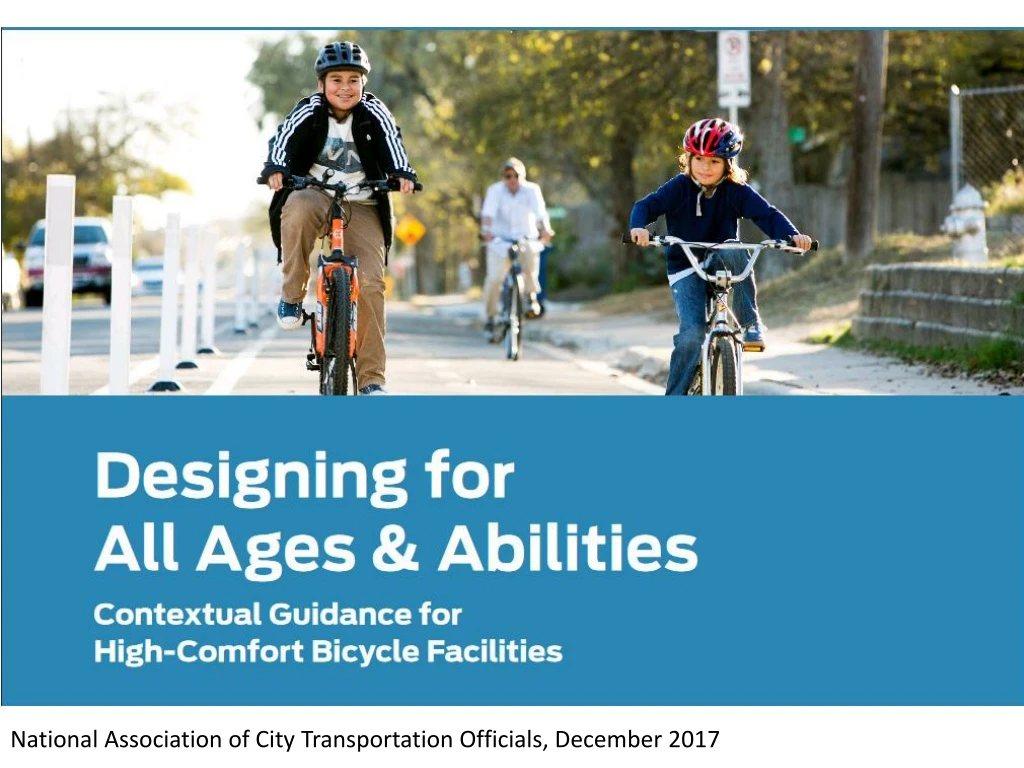
National Association of City Transportation Officials, December 2017
Non-profit organization • Cycling club, incorporated in 1986, serving S. Oregon & N. California • Membership organization with 225 members • roughly 25 percent are Medford residents • annual membership fee is $20 • the Club hosts weekly rides at all endurance and pace levels • Annual membership events • Ice Cream Social • BBQ and Bike Wash • Holiday party • Sponsor Ride of Silence • Co-sponsor of the Up and Down Ride (60 – 100 mile ride along the Cascades Siskiyou Scenic Bikeway)
The Club’s Purpose • Plan, promote and conduct bicycle rides, tours and special events. • Plan, promote and conduct bicycle safety education classes • Promote cycling as a fun and healthy activity • Promote fellowship among cyclists • Encourage bicycle commuting • Support legislation/ordinances that advance the interests of cycling safety and enjoyment • Promote awareness of cyclists’ rights and responsibilities on public thoroughfares • Improve the image of cyclists and cycling within the community at large • Engage in other cycling-related activities as deemed desirable by the Board of Directors and the membership
Who Bicycles? Nationwide studies, including one in Portland, have found that the majority of citizens are “interested in cycling but concerned.” They are concerned about their SAFETY and, more particularly, afraid to share the road with motor vehicles. Source: Four Types of Cyclists, Roger Geller, 2006
Who Rides Bicycles in Medford The City’s survey found that almost 60 percent of Medford residents ride bikes. Source: Summary of Medford Transportation Survey, City of Medford, August 2017
The Oregon Transportation Planning Rule Oregon Administrative Rules (OAR) The City is faced with the same challenge as posed by the Oregon Transportation Planning Rule (TPR) when the Rule was first adopted in 1991. The TPR requires the City to: OAR 660-12-0020(3) “provide safe and convenient vehicular circulation and to enhance, promote and facilitate safe and convenient pedestrian and bicycle travelby planning a well-connected network of streets and supporting improvements for all travel modes.” OAR 660-12-0000(3)c “Within metropolitan areas, coordinated land use and transportation plans are intended to improve livability and accessibility by promoting changes in the transportation system and land use patterns.A key outcome of this effort is a reduction in reliance on single occupant automobile use, particularly during peak periods.“
Too Narrow Bike Lanes Medford, like the rest of the RVMPO cities, have focused almost exclusively on adding bike lanes on major streets (arterial and collector streets). The City’s efforts have often lead to overly narrow lanes for bikes despite the City’s street standards which require five feet wide bike lanes except on major arterials where the City’s code* requires bike lanes to be six feet wide (both measures include the width of the drain pan). * Source: http://www.ci.medford.or.us/codeprint.asp?codeid=4426) Two and one-half feet wide. That is too narrow for safety or comfort. Riding a Bicycle Should Not Require Bravery Source: 2012 AASHTO Bike Guide
Conflicts Increase with Motor Vehicle Speeds & Volumes This chart illustrates the number of passing events (at increasing motor vehicle average speed and volume) experienced over a 10-minute period by a bicyclist riding 10 MPH. As motor vehicle speed and volume increase, they magnify the frequency of stressful events for people riding bicycles. Passing Events 30 MPH Average Vehicle Speed 20 MPH Average Vehicle Speed Average Daily Traffic (ADT) Adapted from Designing for All Ages & Abilities, NACTO, December, 2017
Reducing Vehicular Speeds Decreases Crash Risk and Crash Severity Cyclists (like pedestrians) are less likely to die and suffer fewer injuries when hit by a motor vehicle driving at 20 MPH as compared to 30 MPH or faster. “At low speeds, below about 15 miles per hour (m.p.h.), risks are low.” (AAA Foundation for Traffic Safety) Pedestrian Injuries at Impact Speeds Source: http://guide.saferoutesinfo.org/engineering/slowing_down_traffic.cfm
Existing Unsafe Bicycle Facilities In Medford For Most Adults Youth Seniors Disabled Persons and Families Medford Based upon City of Medford 11/10/17 draft TSP - Figure 10
Planning Benchmarks and Outcomes Despite the more than doubling of the percentage of arterial and collector streets with bike lanes (Measure 3), the bike mode share has remained in the neighborhood of one percent and the region has slipped behind its adopted Bike/Ped mode share benchmark (Measure 1). 21% 28% 37% 37% 54% 48% 60% Percentage Bike/Ped Mode Share 8.2% 8.2% Bike/Ped 8.2 7.3% 8.4% 8.2% 9.8% 11% The percentage of total daily trips taken by a combination of bicycle and walking (non-motorized) modes. Determined from best available data (e.g. model output and/or transportation survey data). Source: Alternative Measures Report, Rogue Valley MPO, 2015
Bike Facility Preference and Safety People riding bikes prefer “more safe” and “high preference” bike-specific facilities. Bike specific facilities include: residential bike routes, residential street bike routes & traffic diverters, cycle track (i.e. separated bikeways or protected bikeways), and bike only paths. W Source: Safety & Route Type, Bicyclists’ Injuries and the Cycling Environment, University of British Columbia
Bicycle Mode Share: 6.1 percent Portland’s TSP provides for a 25% bike mode share by 2035.
National Association of City Transportation Officials, December 2017
What are “All Ages & Abilities” bike facilities? Safe - Better bicycle facilities are directly correlated with increased safety for people walking and driving as well. Comfortable – Bikeways that eliminate stress will attract traditionally under- represented bicyclists, including women, children, and seniors. Equitable - Poor or inadequate infrastructure forces people bicycling to choose between feeling safe and following the rules of the road, and induces wrong-way and sidewalk riding. Where street design provides safe places to ride and manages motor vehicle driver behavior, unsafe bicycling decisions disappear, making ordinary riding safe and legal and reaching more riders.
What is Meant by “All Ages & Abilities?” They are PEOPLE who are: Children: School-age children are an essential cycling demographic but face unique risks and often have less ability to detect risks or negotiate conflicts. Seniors: People aged 65 and over are the fastest growing population group in the US, and the only group with a growing number of car-free households. Bikeways need to serve people with lower visual acuity and slower riding speeds. Women: Women are consistently under-represented as a share of total bicyclists, but the share of women riding increases in correlation to better riding facilities. People Riding Bike Share: Bike share users range widely in stress tolerance, but overwhelmingly prefer to ride in high-quality bikeways. All Ages & Abilities networks are essential to bike share system viability. People of Color While Black and Latino bicyclists make up a rapidly growing segment of the riding population, a recent study found that fewer than 20% of adult Black and Latino bicyclists and non-bicyclists feel comfortable in conventional bicycle lanes; fear of exposure to theft or assault or being a target for enforcement were cited as barriers to bicycling. Families The combination of children, mothers, fathers, grandmothers grandfathers, aunts, uncles, and cousins create a unique set of challenges but their need for safety is easily understood.
What is Meant by “All Ages & Abilities?” - continued They are PEOPLE who are: Low-Income Riders Low-income bicyclists make up half of all Census-reported commuter bicyclists, relying extensively on bicycles for basic transportation needs like getting to work. An All Ages & Abilities bikeway is often needed to bring safe conditions to the major streets these bicyclists already use on a daily basis. People with Disabilities People with disabilities may use adaptive bicycles including tricycles and recumbent handcycles, which often operate at lower speeds, are lower to the ground, or have a wider envelope than other bicycles. High-comfort bicycling conditions provide mobility, health, and independence, often with a higher standard for bike infrastructure needed. People Moving Goods or Cargo Bicycles and tricycles outfitted to carry multiple passengers or cargo, or bicycles pulling trailers, increase the types of trips that can be made by bike, and are not well accommodated by bicycle facilities designed to minimal standards. Confident Cyclists The small percentage of the bicycling population who are very experienced and comfortable riding in mixed motor vehicle traffic conditions are also accommodated by, and often prefer, All Ages & Abilities facilities, though they may still choose to ride in mixed traffic.
The All Ages & Abilities Design Toolbox Five major types of bikeway provide for most bike network needs. Each facility type is appropriate as an All Ages & Abilities bikeway in relevant street contexts. The NACTO Urban Bikeway Design Guide provides detailed guidance on bikeway facilities. 1 - Low-Speed Shared Streets 2 - Bicycle Boulevards 3 - Buffered & Conventional Bicycle Lanes 4 - Protected Bicycle Lanes (also known as Separated Bike Lanes or Cycle Tracks) 5 - Shared-Use & Bicycle Paths
1 - Low-Speed Shared Streets • Very low operating speeds • Volume of people walking/bicycling greater than motor vehicle volume There are no local examples of this type of street.
2 - Bicycle Boulevards (or neighborhood greenways) • Provide continuous comfortable bicycle routes through the local street network • Often on narrow streets with no major destinations • Traffic calming and diverting motor vehicle traffic may be needed Genesssee and Cottage Streets could serve as a bicycle boulevard with speeds reduced to 20 MPH.
3 - Buffered & Conventional Bicycle Lanes • Improve safety and comfort for all users • Suitable where motor vehicle speeds are less than 25 MPH and volumes under 2,500 • Buffered bike lanes are almost always higher comfort than conventional bike lanes Jaunipero (in SE Medford) is a good example of where conventional bike lanes are appropriately matched with speeds and traffic volumes.
4 - Protected Bicycle Lanes (also known as Separated Bike Lanes or Cycle Tracks) • Use a combination of horizontal and vertical separation • Needed when motor vehicle speeds exceed 25 MPH and volumes exceed 6,000 vehicles per day • Robustness of bikeway separation often scales with motor vehicle speeds and volumes There are no local examples of this type of street.
5 - Shared-Use & Bicycle Paths • Can serve as the backbone of an on-street All Ages & Abilities network • Usually do not take riders to their destinations • Ideally bicycles should be separated from pedestrians (where volumes are significant) The Bear Creek Greenway is a good local example of a shared-use path.
Changing the Street: Design, Operation, Networks Design Changing the cross-section of a street in order to provide bike lanes, buffered bike lanes, protected bike lanes, or other dedicated bicycle infrastructure. Change Operation Operational changes—such as speed reduction, signalization and other conflict management, and proactive curbside management
Changing the Street: Design, Operation, Networks (continued) Change the Network Diverting motor vehicle traffic from a street, changing travel direction, (dis)allowing specific types of curbside access, and making other changes
Benefits • • Community health • Two -thirds of adults, and nearly one-third of children, are considered overweight or obese. • • Improved mobility and reduced motor vehicle congestion • Gives people who cannot drive, more and cheaper options for getting around independently to meet everyday needs. • • Neighborhood livability • When residents are out on foot or by bike, they interact more with neighbors. Residential streets become calmer and quieter. • • More vibrant economy • Lower transportation costs for individuals and families; increased property values in traffic-calmed neighborhoods; savings to cities from less wear and tear on streets and less demand for roadway improvements and parking lots. • • Improved environment • Reduced air pollution and emissions of greenhouse gases. Other environmental benefits include energy savings; less noise pollution; less water pollution; and even reduced pressure to develop • agricultural and open space. • .
Conclusions • All Ages and Abilities designs are achievable • All Ages and Abilities designs offer multiple approaches to creating a safe and convenient bicycle network • More of the region’s citizens will bicycle with safe and convenient facilities • The existing on-street bicycle transportation system is unsafe for most adults, youth, disabled, senior, and families • Though challenges lie ahead, we are confident the region’s engineers and planners can design and implement a safe and convenient bicycle network
How Can You Help? Modify the RTP to reflect a commitment to “all ages and abilities” designs. Modify the RVMPO benchmarks to provide for a 10 percent (or higher) mode share for bikes by 2035. Modify the MTIP project ranking criteria to prioritize projects that include “all ages and abilities” designs. Provide for dedicated funding for stand-alone “all ages and abilities” bike facilities projects with an emphasis on separated bikeways. Reduce the posted speeds: On residential streets to 20 MPH (see ORS 810.180(8) On all streets with bicycle facilities, that do not conform to the NACTO designs, to a maximum of 20 MPH* (see ORS 810.180(5) - as a safety measure) Thank YOU!
The End Return To Siskiyou Velo Homepage Thank You.
https://medford.maps.arcgis.com/apps/webappviewer/index.html?id=b5009c630eeb4d6b97a96d98b8b6420ehttps://medford.maps.arcgis.com/apps/webappviewer/index.html?id=b5009c630eeb4d6b97a96d98b8b6420e