Generalized Model of Lockage Delay Based on Historic Data
200 likes | 367 Vues
Generalized Model of Lockage Delay Based on Historic Data. Michael R. Hilliard, Ph.D. Center for Transportation Analysis Oak Ridge National Laboratory Smart Rivers, 2011 New Orleans. Ohio River Navigation Investment Model (ORNIM). Construction Plans.

Generalized Model of Lockage Delay Based on Historic Data
E N D
Presentation Transcript
Generalized Model of Lockage Delay Based on Historic Data Michael R. Hilliard, Ph.D. Center for Transportation Analysis Oak Ridge National Laboratory Smart Rivers, 2011 New Orleans
Ohio River Navigation Investment Model (ORNIM) Construction Plans • Goal: Maximize net benefits from national investments in infrastructure • Estimate waterway usage under future scenarios • 50-70 year time horizon • Lock Transit time estimates determine delay costs and influence shipment levels. Random Closure Probabilities Repair Plans and Costs Reliability Estimates Lock Risk Module Optimal Investment Module Cargo Forecasts Waterway Supply and Demand Module Optimal Investment in Projects and Maintenance Towboat/Barge Operations Lock Operations River Network
Transit Curves are a foundation of analysis. • Systems approach requires curves for ALL locks in the system. • Some locks are more critical for a given analysis. 1 (Processing_rate — Arrival_rate) Transit Time (hours) Number of Vessels Or Total Tonnage M/M/1 Queue Average_transit =
Multiple Roads to Transit Curves Lockage Component Distributions Simulation Results Time Period Averages Fitted Transit Curves Historic Lockage Data Individual Lockage Estimates Simple Simulation Results Lock Groups
Multiple Roads to Transit Curves Lockage Component Distributions Simulation Results Time Period Averages Fitted Transit Curves Historic Lockage Data Individual Lockage Estimates Simple Simulation Results Lock Groups
Multiple Roads to Transit Curves Lockage Component Distributions Simulation Results Time Period Averages Fitted Transit Curves Historic Lockage Data Individual Lockage Estimates Simple Simulation Results Lock Groups
Multiple Roads to Transit Curves Lockage Component Distributions Simulation Results Time Period Averages Fitted Transit Curves Historic Lockage Data Individual Lockage Estimates Simple Simulation Results Lock Groups
Individual Estimations • Each transit record becomes a data item • Error checking on data • Rolling average of arrival and processing rates • Arrival rate = average arrival rate of last 20 tows • Processing Rate = average of last 20 lockages Benefits • Seasonality captured • Variations in processing over time allowed • Fitting to 1000s of points—Trade details for large numbers
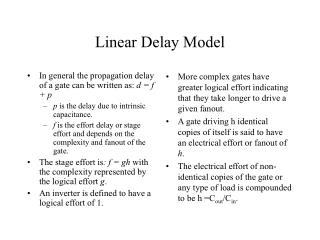
Transform and generalize the model Average_transit = 1 (Processing_rate — Arrival_rate) Log(Average_transit) = -Log(Processing_rate — Arrival_rate) Log(Average_transit) = C+B*Log(Processing_rate — Arrival_rate) D_Rate Linear Fit
But sometimes they don’t • Construction & closures • Changes to lock structures • Very low traffic levels
Multiple Roads to Transit Curves Lockage Component Distributions Simulation Results Time Period Averages Fitted Transit Curves Historic Lockage Data Individual Lockage Estimates Simple Simulation Results Lock Groups • Size • Up/Down ratio • etc.
Currently experimenting with ways to use the parameters. Direct Formula Simple Simulation Spreadsheet based simulation Arrival rate varies to match seasonality (with or without randomness) Quick model of changes to processing times or planned closures. • Assume “consistent” arrivals • Assume average processing rate • Guaranteed to be a “nice” curve • Increasing delay • Accelerating • Limited capacity