Comparative Efficacy and Safety of NRTI Combinations in HIV Treatment: TAF vs. TDF
60 likes | 177 Vues
This study evaluates the virologic efficacy and safety of two NRTI combinations, EVG/c/FTC/TAF and EVG/c/FTC/TDF, in treatment-naive HIV-positive adults over 48 weeks. Findings indicate comparable virologic suppression rates in both regimens. Notably, the TAF regimen demonstrated significantly greater preservation of bone mineral density and lower rates of adverse events compared to TDF, suggesting reduced end-organ toxicity. Results from this randomized, double-blind trial highlight the potential benefits of TAF in HIV management and underline important considerations for treatment regimens.

Comparative Efficacy and Safety of NRTI Combinations in HIV Treatment: TAF vs. TDF
E N D
Presentation Transcript
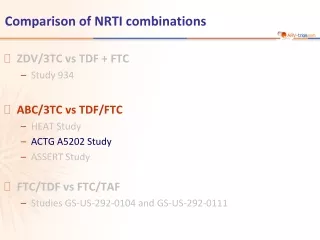
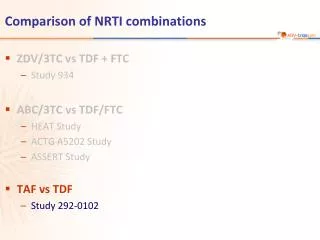
Comparison of NRTI combinations • ZDV/3TC vs TDF + FTC • Study 934 • ABC/3TC vs TDF/FTC • HEAT Study • ACTG A5202 Study • ASSERT Study • TAF vs TDF • Study 292-0102
Study 292-0102: EVG/c/FTC/TAF QD vs EVG/c/FTC/TDF QD (Phase 2) • Design Randomisation* 2 : 1 Double-blind W24 W48 N = 112 > 18 years ARV-naïve HIV RNA > 5,000 c/mL CD4 cell count > 50/mm3 eGFR > 70 mL/min N =58 *Randomisation was stratified by HIV RNA (< or > 100,000 c/mL) at screening • Primary objective • Determine virologic efficacy of EVG/c/FTC/TAF • 150 patients provide 76% power to detect a 1.5% (SD of 3.3%) difference in hip bone mineral density in the EVG/c/FTC/TAF arm relative to the EVG/c/FTC/TDF arm Sax PE. JAIDS 2014;67:52-8 2920102/TAF phase 2
Baseline characteristics Median viral load at baseline : 4.6 log10 c/mL (21% > 100,000 c/mL), median CD4+ cell count : 391 cells/mm3 (15% > 200/mm3) Main results Discontinuation due to adverse events by W48 : 4 in TAF arm vs 0 in TDF arm HIV RNA < 50 c/mL at W24 : 87.5% E/c/F/TAF vs 89.7% E/c/F/TDF 3 patients in each arm met criteria for resistance testing (virologic failure [2 consecutive HIV RNA > 50 c/mL] with HIV RNA > 400 c/mL). Genotype was performed on confirmatory sample E/c/F/TAF : no resistance detected E/c/F/TDF : 2 patients developed resistance, 1 to NRTI, 1 to INSTI + NRTI PK substudy : plasma TFV exposure was 91% lower with E/c/F/TAF than with E/c/F/TDF, as measured by AUCtau. Conversely, intracellular TFV-DP levels in PBMCs were 5.3-fold higher with E/c/F/TAF Study 292-0102: EVG/c/FTC/TAF QD vs EVG/c/FTC/TDF QD (Phase 2) Sax PE. JAIDS 2014;67:52-8 2920102/TAF phase 2
Safety Significantly less change in the E/c/F/TAF arm in BMD at hip (-0.62% vs -2.39%, p < 0.001) and lumbar spine (-1.0% vs -3.37%, p < 0.001) at W48, which were also significant at week 24 In the E/c/F/TAF arm, 32% of patients had no decrease in hip BMD vs 7% in the E/c/F/TDF arm (p < 0.001) Median change in eGFR by Cockcroft–Gault = -5.5 mL/min for E/c/F/TAF vs -10.1 mL/min for E/c/F/TDF (p = 0.041) Renal tubular proteinuria [urine retinol-binding protein/creatinine ratio and urine b-2 microglobulin/creatinine ratio] was significantly lower in patients who received E/c/F/TAF : no cases of proximal tubulopathy Grade 3-4 adverse events : 9.8% TAF vs 5.2% TDF Most common treatment-emergent adverse events : nausea (21% vs 12%), diarrhea (16% in each arm) Higher elevations in lipids with TAF Study 292-0102: EVG/c/FTC/TAF QD vs EVG/c/FTC/TDF QD (Phase 2) Sax PE. JAIDS 2014;67:52-8 2920102/TAF phase 2
Study 292-0102: EVG/c/FTC/TAF QD vs EVG/c/FTC/TDF QD (Phase 2) • Grade 3 or 4 laboratory abnormalities Sax PE. JAIDS 2014;67:52-8 2920102/TAF phase 2
Summary of week 48 results In this phase 2, randomised clinical trial, HIV-positive treatment-naive adults received STRs of E/c/F/TAF or E/c/F/TDF. Both STRs demonstrated high and comparable rates of virologic suppression through 48 weeks of therapy Both regimens were well tolerated, with few discontinuations due to adverse events. Nausea occurred more frequently with E/c/F/TAF Plasma concentrations of TFV were substantially (91%) lower with E/c/F/TAF than with E/c/ F/TDF, and the TAF regimen delivered 5.3 times the intracellular, physiologically active metabolite, TFV-DP, to PBMCs, which could translate into less end-organ toxicity and/or improved virologic control Significant smaller decreases in bone mineral density through 48 with E/c/F/TAF than with E/c/F/TDF Urinary RBP/creatinine and b-2 microglobulin/creatinine ratios were significantly lower in the E/c/F/TAF arm, which suggests that TAF has a lesser effect than TDF on the proximal renal tubular cell Study 292-0102: EVG/c/FTC/TAF QD vs EVG/c/FTC/TDF QD (Phase 2) Sax PE. JAIDS 2014;67:52-8 2920102/TAF phase 2