Download
1 / 13
130 likes | 241 Vues
COMMUNITY PROFILE Essex, Kent, Lambton (EKL) In partnership with Statistics Canada. Community Profile Highlights. Highlights in EKL (2001 to 2006):. Population is steady Francophone community is shrinking Aboriginal community is growing Population is aging Diversity is increasing.

E N D
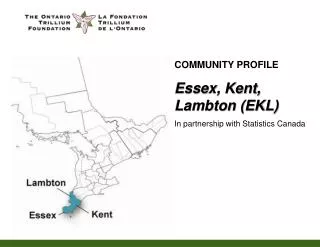
COMMUNITY PROFILE Essex, Kent, Lambton (EKL) In partnership with Statistics Canada
Community Profile Highlights Highlights in EKL (2001 to 2006): • Population is steady • Francophone community is shrinking • Aboriginal community is growing • Population is aging • Diversity is increasing
Population is Steady In 2006 there were 630,195 people living in EKL, which accounts for 5.2% of Ontario’s total population
Population is Steady EKL’s population growth rate between 2001 and 2006 was similar to the previous 5-year period
Francophone Community Shrinking • EKL’s Francophone community decreased by 9.1% between 2001 and 2006 • Despite decreasing numbers, EKL’s Francophone community is substantial - over 20,000 people • In Essex, the area with the largest Francophone community in the region, there was a 10.5% decrease (1,765 people) in the Francophone population from 16,760 to 14,995
Growing Aboriginal Community • EKL’s Aboriginal community grew by 2,990 (25%) to 14,890 • There are four Indian Reserves in EKL • More than a third of the Aboriginal population live in Windsor (26.6%) and Sarnia (10.0%)
EKL’s Population is Aging • EKL is slightly older compared to the province • EKL has proportionately more people in each age category over 55 than the province overall • Seniors account for a larger proportion of the population in EKL (14.5% ) than in Ontario overall (13.6%) • EKL’s median age has been rising faster than Ontario’s • This is particularly pronounced in Chatham-Kent and Lambton, where the median age has risen by 2.7 and 2.8 years respectively
Growing Ethno-cultural Diversity • Immigration is on the rise • There were 17,215 recent immigrants to EKL • One-half of all newcomers came from Asia and the Middle East; European-born people made up the second largest group • The majority of newcomers are settling in Essex
Growing Ethno-cultural Diversity • Diverse Community • Almost 1 in 5 EKL residents are foreign-born • The Black community is the largest visible minority group in EKL followed by South Asian and Arab • Of the 63,165 visible minorities in EKL, 85% lived in the Essex area
Growing Ethno-cultural Diversity • Top Five Mother Tongues: • (other than English & French) • ONTARIO • Italian • Chinese (not specified) • Cantonese • Spanish • German • EKL • German • Dutch • Italian • Hungarian • Spanish
Community Profile Highlights • Also of Interest: • In 2006 the number of people employed was increasing, although employment growth was at a slower rate than for the province overall • One in five EKL residents have a university degree, certificate or diploma, compared to one in three for the province • Both Chatham-Kent and Lambton County have reversed the declining population trend noted in the previous census
Additional Information This document presents highlights from the EKL Community Profile To view the full report, please refer to the Ontario Trillium Foundation (OTF) website at www.trilliumfoundation.org There you will find the Community Profiles for OTF’s 16 catchment areas and the province overall The Community Profiles were produced in partnership with Statistics Canada, using the most recent 2006 Census information We hope that they will be of benefit to Ontario’s not-for-profit sector