Download
1 / 48
480 likes | 684 Vues
Probabilit y and Statistics. Course Requirements. Quizzes – 25%. First Long Exam – 25%. Second Long Exam – 25%. Third Long Exam – 25%. Total – 100%. Passing – 60%. Probabilit y and Statistics. Statistics.

E N D
Probability and Statistics Course Requirements Quizzes – 25% First Long Exam – 25% Second Long Exam – 25% Third Long Exam – 25% Total – 100% • Passing – 60%
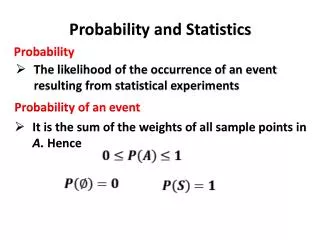
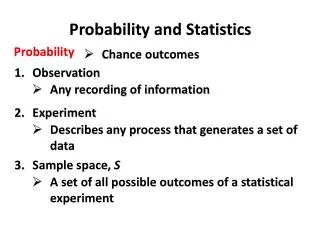
Probability and Statistics Statistics • A branch of mathematics that deals with the collection, organization and analysis of numerical data and with such problems as experiment design and decision making. 3 Important features of Statistics: Data gathering Data analysis Making decision
Probability and Statistics Definition of terms Raw data • Data collected in original form Variable • Characteristic or attribute that can assume different values Population • All subjects possessing a common characteristic that is being studied
Probability and Statistics Definition of terms Sample • A subgroup or subset of a population Parameter • Characteristic or measure obtained from a population Qualitative variables • Variables which assume non-numerical values
Probability and Statistics Definition of terms Quantitative variables • variables which assume numerical values Discrete variables • Variables which assume finite or countable number of possible values, usually obtained by counting Continuous variables • Variables which assume infinite number of possible values, usually obtained by measurement
Probability and Statistics • Everyone involved in the experiment must have a clear idea about what is to be studied, how the data is to be collected and at least a qualitative understanding as to how these data are to be analyzed. Guidelines for designing experiments: Statement of the problem / recognition of the problem • Develop all the ideas about the objectives of the experiment
Probability and Statistics Guidelines for designing experiments: Choice of factors and levels • Choose the factors to be varied in the experiment • Choose the ranges over which these factors will be varied • Identify the specific levels at which runs will be made
Probability and Statistics Guidelines for designing experiments: Selection of the response variable • The experimenter should be certain that this variable really provides useful information about the process under study Choice of experimental design • Involves the consideration of sample size (number of replicates/trials), the selection of a suitable run order for the experimental trials, and the determination of whether or not blocking or other randomization restrictions involved.
Probability and Statistics Guidelines for designing experiments: Performing the experiment • Monitor the process carefully to ensure that everything is being done according to plan Data analysis • Analyzing the data collected during the experiment by statistical methods Conclusions • Making decision based on the statistical results
Probability and Statistics Methods of Sampling Random sampling • sampling in which the data is collected using chance methods or random numbers. Systematic sampling • Sampling in which the data is collected by selecting every kth object Stratified sampling • Sampling in which the population is divided into groups (strata) according to some characteristic. Each strata is then sampled either random or systematic
Probability and Statistics Methods of Sampling Cluster sampling • sampling in which the population is divided into groups (usually geographically). Some of these groups are randomly selected, and then all of the elements in those groups are selected.
Probability and Statistics Methods of Summarizing/Characterizing Data Tabular Methods Frequency Distribution Cumulative Frequency Stem and Leaf Table Graphical Methods Frequency Histogram Frequency Polygon Ogive Pie chart
Probability and Statistics Methods of Summarizing/Characterizing Data Numerical Methods Measures of Central Tendencies • Mean/Average, Median, Mode Measures of Dispersion • Range, Variance, Standard Deviation Measures of Shape • Skewness, Kurtosis Measures of Data Locations • Percentiles, Deciles, Quartiles
Probability and Statistics Tabular Methods Frequency Distribution • The organization of raw data in tabular form with classes and frequencies Steps in Constructing a Frequency Distribution Table: Determine the number of class intervals, k, needed to summarize the data: No. of samples No. of class intervals
Probability and Statistics Tabular Methods Steps in Constructing a Frequency Distribution Table: Find the range of observations Minimum value Range Maximum value
Probability and Statistics Tabular Methods Steps in Constructing a Frequency Distribution Table: Determine the width of the class intervals Range No. of class intervals Class width
Probability and Statistics Tabular Methods Steps in Constructing a Frequency Distribution Table: Form the frequency table Class interval • Separates one class in a grouped frequency from the other • The interval could actually appear in the raw data and it begins with the lowest value
Probability and Statistics Tabular Methods Steps in Constructing a Frequency Distribution Table: Form the frequency table Class boundary • Separates one class in a grouped frequency from the other • It has one more decimal place than the raw data and therefore it does not appear in the data
Probability and Statistics Tabular Methods Steps in Constructing a Frequency Distribution Table: Form the frequency table Class boundary
Probability and Statistics Tabular Methods Steps in Constructing a Frequency Distribution Table: Form the frequency table Class Mark (Midpoint), xi • The number in the middle of the class
Probability and Statistics Tabular Methods Steps in Constructing a Frequency Distribution Table: Form the frequency table Frequency, fi • The number of times a certain value or class of values occurs
Probability and Statistics Tabular Methods Steps in Constructing a Frequency Distribution Table: Form the frequency table Relative Frequency, % • Frequency divided by the total number of data • This gives the percent of values falling in that class
Probability and Statistics Tabular Methods Steps in Constructing a Frequency Distribution Table: Illustration: the nicotine contents, in milligrams, for 40 cigarettes of a certain brand were recorded as follows: 1.09 1.92 2.31 1.79 2.28 1.74 1.47 1.97 0.85 1.24 1.58 2.03 1.70 2.17 2.55 2.11 1.86 1.90 1.68 1.51 1.64 0.72 1.69 1.85 1.82 1.79 2.46 1.88 2.08 1.67 1.37 1.93 1.40 1.64 2.09 1.75 1.63 2.37 1.75 1.69
Probability and Statistics Tabular Methods Steps in Constructing a Frequency Distribution Table: Illustration: the nicotine contents, in milligrams, for 40 cigarettes of a certain brand were recorded as follows: 1.09 1.92 2.31 1.79 2.28 1.74 1.47 1.97 0.85 1.24 1.58 2.03 1.70 2.17 2.55 2.11 1.86 1.90 1.68 1.51 1.64 0.72 1.69 1.85 1.82 1.79 2.46 1.88 2.08 1.67 1.37 1.93 1.40 1.64 2.09 1.75 1.63 2.37 1.75 1.69
Probability and Statistics Tabular Methods Steps in Constructing a Frequency Distribution Table: Illustration: the nicotine contents, in milligrams, for 40 cigarettes of a certain brand were recorded as follows:
Probability and Statistics Tabular Methods Cumulative Frequency Distribution Table: Cumulative Frequency, cfi • Gives the running total of the frequencies • The number of observations in the sample whose values are less than or equal to the upper boundary of the class interval Relative Cumulative Frequency • (cfi/ total number of samples) * 100 • Percent of the values which are less than the upper boundary
Probability and Statistics Tabular Methods Cumulative Frequency Distribution Table:
Probability and Statistics Graphical Methods Frequency Histogram • A graph which displays the data by using vertical bars of various heights to represent frequencies • The horizontal axis can either be class intervals, class boundaries, or class marks
Probability and Statistics Graphical Methods Frequency Histogram frequency Class mark
Probability and Statistics Graphical Methods Frequency Polygon • A line graph between frequency and class mark frequency Class mark
Probability and Statistics Graphical Methods Ogive • A frequency polygon of relative cumulative frequency against upper class boundaries Relative cumulative frequency Upper class boundary
Probability and Statistics Graphical Methods Pie chart • The degree of slice is based on the relative frequency
Probability and Statistics Numerical Methods Measures of Central Tendencies Mean / Average • The sum of the product of class mark and the corresponding frequency divided by the total number of samples
Probability and Statistics Numerical Methods Measures of Central Tendencies Median • The value that will divide the samples into two equal halves when the samples are arranged from lowest to highest Total frequencies of all class intervals before the median class Frequency of the median class Lower class boundary of the median class
Probability and Statistics Numerical Methods Measures of Central Tendencies Mode • The most frequent number Lower class boundary of the modal class Frequency difference of the modal class and the succeeding class Frequency difference of the modal class and the preceeding class
Probability and Statistics Numerical Methods Measures of Variability / Dispersion Range • Measures how the samples are clustered. • It is the difference between the highest and the lowest values of the raw data Minimum value Range Maximum value
Probability and Statistics Numerical Methods Measures of Variability / Dispersion Variance • Measures how the samples are dispersed.
Probability and Statistics Numerical Methods Measures of Variability / Dispersion Standard deviation, s • The positive square root of the variance • Coefficient of variation, Cv • If Cv < 10 – the data are considered clustered, else the data are dispersed
Probability and Statistics Numerical Methods Measures of Shape Skewness • A measure of the symmetry of the distribution of the sample • If Sk < 0 – the distribution is skewed to the left (i.e., left tail is longer than right tail)
Probability and Statistics Numerical Methods Measures of Shape Skewness • A measure of the symmetry of the distribution of the sample • If Sk = 0 – the distribution is symmetric with respect to the mean, i.e., right and left tails are of equal length (the distribution is called normal or Gaussian)
Probability and Statistics Numerical Methods Measures of Shape Skewness • A measure of the symmetry of the distribution of the sample • If Sk > 0 – the distribution is skewed to the right (i.e., right tail is longer than left tail)
Probability and Statistics Numerical Methods Measures of Shape Kurtosis • A measure of the height of the distribution • If kurtosis < 0 – the distribution has short height or is almost flat
Probability and Statistics Numerical Methods Measures of Shape Kurtosis • A measure of the height of the distribution • If kurtosis = 0 – the distribution has the right height
Probability and Statistics Numerical Methods Measures of Shape Kurtosis • A measure of the height of the distribution • If kurtosis > 0 – the distribution has a high peak
Probability and Statistics Numerical Methods Measures of Data Location Quartiles: Q1, Q2, Q3 • It is the 25%, 50% and 75% respectively of the data Deciles: D1, D2, D3, … D9 • It is the 10%, 20%, 30%,…90% respectively of the data Percentile: P1, P2, P3, … P99 • It is the 1%, 2%, 3%,…99% respectively of the data
Probability and Statistics Quiz The diameter of 36 rivet heads in 1/100 of an inch is given below: Construct a Cumulative Frequency Table Determine the Mean, Median and Mode Determine the Variance, Standard deviation and the coefficient of variation Determine the skewness and kurtosis of the distribution and make a conclusion about the shape of the distribution