Understanding Statistics: Central Tendency, Spread, and Population Inference
This overview presents key concepts in statistics, focusing on measures of central tendency and spread. Central tendency includes the mean, median, and mode, each with unique benefits and challenges, particularly regarding sensitivity to extreme values. Measures of spread, such as range, inter-quartile range, and standard deviation, are crucial for understanding data variability. This guide elucidates how sample statistics inform inferences about broader population parameters, providing a foundational knowledge for analyzing and interpreting statistical data effectively.

Understanding Statistics: Central Tendency, Spread, and Population Inference
E N D
Presentation Transcript
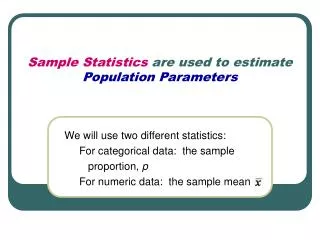
Statistics describe features of the sample What statistics do we use? How are they calculated?
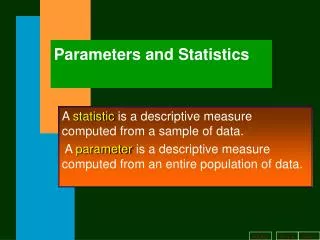
We use sample statistics to make inferences about population parameters Proportion Central tendency Variation or spread Shape Unusual features
The Mean is easy to calculate and is also easily understood. BUT! It is affected by extreme values. The Measures of Central Tendency
The Median is unaffected by extreme values, but it is more difficult to calculate as the data has to be ordered first. BUT! It is UNaffected by extreme values. The Measures of Central Tendency
The Mode is useful to manufacturers who want to identify the most popular value. BUT! It is not always typical of a population as a whole. The Measures of Central Tendency
The Mean is easy to calculate and is understood. BUT! It is affected by extreme values. The Measures of Central Tendency
The Range is the difference between the maximum and minimum values. The range is easy to calculate and understand. BUT! If there are extreme values, the range does not accurately reflect how spread out the data values are. The Measures of Spread
The Inter-quartile Range is the difference between the upper quartiles and the lower quartile and gives the range of the middle 50% of the data. As the extreme values are outside the middle 50% of the data, the inter-quartile range gives a clear indication of the spread. The Measures of Spread
The Standard deviation is a calculated measure of spread which is shows how much variance there is from the mean. You can safely conclude that a set of data with a larger standard deviation is more spread out than a set of data with a smaller standard deviation. The Measures of Spread