Download
1 / 7
90 likes | 583 Vues
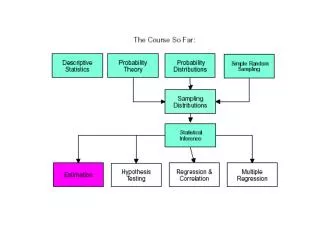
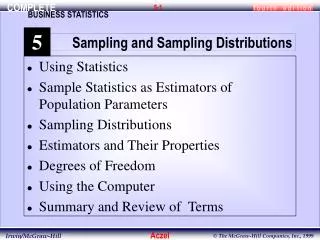
Sample Statistics are used to estimate Population Parameters. We will use two different statistics: For categorical data: the sample proportion, p For numeric data: the sample mean . Sample Statistics. Have sampling distributions

E N D
Sample Statistics are used to estimatePopulation Parameters We will use two different statistics: For categorical data: the sample proportion, p For numeric data: the sample mean
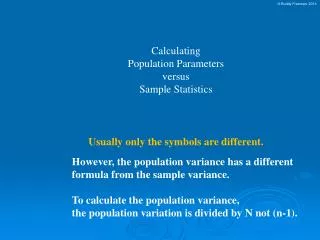
Sample Statistics • Have sampling distributions • Shape: normal if you follow the ‘rules’ • Center: equal to the parameter we’re estimating if we take a random sample • Spread: related to the population standard deviations by a factor of 1/n
Sample Proportion, p • Shape:Normal if n and n(1-) ≥10 • Center:(p) = • Spread: (p) =(1-)/n
Example for sample proportions: • Toss a coin 30 times. The probability of getting a head is 80%. • This is a binomial trial because: • Each toss is independent of all of the other tosses • There is a fixed number of tosses, n = 30 • There is a fixed probability of success, = 0.80
Example con’t • What is the distribution of our sample proportion? • Shape:Normal if n and n(1-) ≥10 • n = 30*0.80 = 24, • n(1-) = 30*0.20 = 6, • so we can’t say the shape is normal • Center:(p) = • (p) = = 0.80 • Spread:(p) =(1-)/n • (p) =(1-)/n = (0.8*0.2/30) = 0.073
Sample Mean, • Shape:Normal if • the original data is normal, X~N(x, x2), or • n is large, at least 30 • Center:( ) = x • Spread:( ) =/n
Example of a sample mean, • If X~N(15, 22), what is the distribution of ? • Since X is normal is also normal • The mean is the same, 15 • The standard deviation is 2/36 = 1/3 • So, ~ N( 15, (1/3)2)