Sample Data Analysis in Statistics Education: Making Effective Point Estimates Using a Sample
190 likes | 291 Vues
Explore the process of making point estimates by analyzing sample data from Stage 1 Statistics students at Auckland University. Learn how to formulate questions, gather data through surveys, analyze and compare subsets of data, interpret distributions, and understand sampling errors in statistics education.

Sample Data Analysis in Statistics Education: Making Effective Point Estimates Using a Sample
E N D
Presentation Transcript
Using a sample to make a point estimate Stage 1 Statistics students from Auckland university
Stage 1 Statistics Data • Internet based survey • Stage 1 students at Auckland University in 2009 • Students invited to complete the survey and gain 2 marks towards their first assignment, marked out of ten.
Problem • What sort of question is this? • How would we have worded this question last year? (Level 1) • What other sort of investigative questions are there? • What makes a good question? • I wonder what the median weight of Stage 1 Statistics students at Auckland University is?
Reminders… Question types Good questions • SUMMARY • Description of one variable • COMPARISON • Comparing two (or more) subsets of data across a common numeric variable • RELATIONSHIP • Looking at the interrelationship between two paired numeric variables • Can be answered with the data • Population of interest is clear • Variable(s) of interest is clear • Intent (summary, comparison, relationship) is clear • Someone is interested in the answer
I wonder what the median weight of Stage 1 Statistics students at Auckland University is? • What do you think the median weight will be? • Why? • Sketch the shape of the distribution of weights of Stage 1 Statistics students from Auckland University.
Plan • What variable are we going to use to answer our question? • How are we going to gather our data? • Everyone? • Sample? • Simple random sample of 15 students please.
Data • SRS of 15 students • Make sure you don’t sample the same student more than once
Calculator reminder • Run menu • OPTN • > (F6) • PROB • RAND • Int • RanInt#(1,1370)
Calculator reminder • Run menu • OPTN • > (F6) • PROB • RAN# • Ran# x 1370 + 1 • Ignore decimals
Analysis • Plot dot plot on axes • Add box plot above • Note the 5 point summary • {Minimum, lower quartile, median, upper quartile, maximum}
Analysis • Repeat three more times to complete 4 sets of 15 samples • Write (at least) three “I notice…” statements about your samples • Look at shape and spread – what do you notice? • Similarities? Differences? – between your sets of samples…
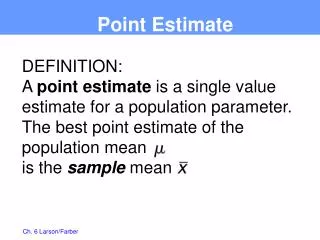
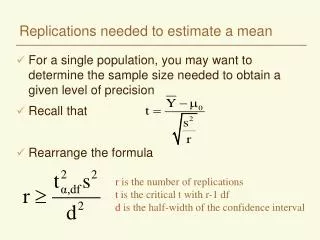
Conclusion Use sample median to provide a point estimate of the population parameter • From my sample data I estimate that the median weight for all Stage 1 statistics students at Auckland University is….
Conclusion • But they’re all different! • Who is right? • From my sample data I estimate that the median weight for all Stage 1 statistics students at Auckland University is….
Everyone’s plots • What do you notice?
Everyone’s plots • What do you notice? • Samples are all different • All centred (clustered) around the same values • Mostly skewed to the right • Medians fall within a band, an interval
Everyone’s plots • How can we use our sample to predict what is going on back in the population? • The sample median is our best idea of the population median
Sampling error • The process of taking a sample and using the median of the sample to predict the population median will never produce the exact value of the population median. • This is called sampling error • The difference between the sample median and the true value back in the population