Download
1 / 19
190 likes | 366 Vues
Crustal Structure and Deformation in the Northern California Coast Ranges. Gavin P. Hayes 1 , Kevin P. Furlong 1 , S. Schwartz 2 , C. Hall 2 , C. Ammon 1. 1. Department of Geosciences, Penn State University 2. Earth Sciences Department, University of California Santa Cruz. Regional Overview

E N D
Crustal Structure and Deformation in the Northern California Coast Ranges Gavin P. Hayes1, Kevin P. Furlong1, S. Schwartz2, C. Hall2, C. Ammon1 1. Department of Geosciences, Penn State University 2. Earth Sciences Department, University of California Santa Cruz
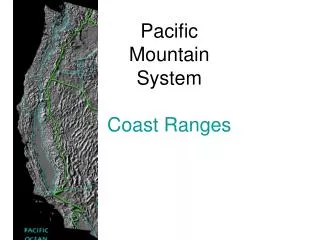
Regional Overview • Area of study in Northern California, between San Francisco Bay and the Mendocino triple junction. • Data available from 5 local seismic stations; 3 permanent and 2 temporary. • Research aims to test models of thickening and thinning associated with the northward migration of the triple junction.
The Mendocino Crustal Conveyor (MCC) • Furlong and Govers (Geology, 1999) • As the triple junction migrates north, upwelling asthenosphere fills the ‘slab gap’ and accretes to both plates. • This coupling pulls North America into itself, causing crustal thickening, and thinning further south.
The Mendocino Crustal Conveyor (MCC) • We can use this model to infer what we expect at each location. • The MCC suggests thickest crusts at CVLO, thinning towards FREY and HOPS. FREY should be located above this transition. • Mafic underplating may be expected at HOPS and CVS. • KCPB is slightly out of the plane affected by MCC processes.
Volcanism Associated with the MCC • Areas of volcanism are found in the wake of the migrating triple junction. • The most recent surface expression of volcanism is seen at Clear Lake (~0.1-2Ma). • Since this time, the triple junction has moved north ~100km • Melt and future volcanism may be expected north of Clear Lake.
KCPB Receiver Function • The most prominent feature is the high amplitude Ps conversion at ~3s associated with an ~8km thick high velocity zone at the base of the crust. • We interpret this as a potential fragment of old oceanic crust migrating northward with the Pacific Plate. • North American crust at this location has a thickness of ~19km.
The Pioneer Fragment Plate reconstructions from Tanya Atwater (UCSB web site) Pioneer Fragment Pioneer Fragment Pioneer Fracture Zone • High velocity body imaged in tomography • The Pioneer Fragment is a piece of the Farallon Plate trapped by the Pacific Plate when subduction ceased and the MTJ formed. • It has migrated northwards with the Pacific to where we find it now beneath KCPB.
The Pioneer Fragment Pioneer Fragment KCPB • High velocity body imaged in tomography • The Pioneer Fragment is a piece of the Farallon Plate trapped by the Pacific Plate when subduction ceased and the MTJ formed. • It has migrated northwards with the Pacific to where we find it now beneath KCPB.
CVS Receiver Function • CVS receiver function is characterized by very low amplitude conversions, implying a crust with no major velocity contrasts. • Rather, the best-fitting model involves a gradational mid-crust, and a total thickness of ~23km. • Horizon E is thought to be a layer of underplating rather than being part of the North American crust.
CVLO Receiver Function • CVLO is located above (and slightly south of) the area of maximum thickening in the MCC model. • The best-fitting model implies a crustal thickness of ~35km.
FREY Receiver Function • Best-fitting model for FREY suggests a crustal thickness of ~25km, with a low velocity zone in the mid crust. • This LVZ is necessary to create the high negative amplitude conversion at ~7s. • The large difference in crustal thickness between CVLO and FREY implies rapid thinning (~10km) over a distance of ~50km.
HOPS Receiver Function • HOPS best-fitting velocity model is a relatively simple 4-layer crust of ~22km thickness. • The pattern of crustal deformation associated with the MCC seems to be complete by this point (crustal thickness is relatively constant from this point south).
Implications for Deformation • Receiver Functions show thinning is localized between CVLO and FREY. • FREY can give us detailed information about extension characteristics, and should be analyzed in more detail. • Is the low velocity zone at FREY related to deformation processes?
A Closer Look at FREY • Located in central area of Coast Ranges, where the MCC predicts thinning to occur. • Receiver Function indicates a Low Velocity Zone, with a high Poisson’s Ratio, in the mid-crust. • This zone can be interpreted as a layer of basaltic partial melt associated with slab window processes. • Active volcanism south of the FREY station at Clear Lake
Evidence For Zone of Melt • Reflection surveys in the area of FREY have identified a similar zone of crustal melt. • Henstock and Levander (2000) suggest two 100-500m thick VLVZ’s with a lateral extent of 1-4km, at depths of ~20km and ~26km. • Both zones are interpreted as areas of basaltic melt.
Evidence For Zone of Melt • Reflection survey images partial melt zone(s) as 2 dipping bright spots, with little constraint on the thickness and velocity of the ‘intermediate’ layer. • Receiver Function contains Ps and PpPs conversions from both the top and base of the melt layer, constraining its thickness, velocity and continuity. • The Moho is also clear in the Receiver Function, but not in the reflection survey.
Back Azimuthal Variation • Slight azimuthal variation is evident in Receiver Functions from the NW, W and SW. • Significant Variation in apparent structure is evident from RF’s from the South East, shown here. • These RF’s suggest a simple 3 layer crustal model, with no LVZ.
Localized Crustal Deformation at FREY? • Evidence for a zone of melt beneath FREY can be used to infer a localization of rapid crustal thinning in this area. • Extension opens ‘pathways’ in the crust through which the melt rises, ponding at a depth of density equilibrium. • These spatially rapid changes in crustal structure are driven by processes at the base of the crust, rather than plate convergence. • Melt in this area is likely a result of upwelling asthenosphere filling the gap left behind by the northward-migrating Gorda Slab. • Implications for rapid thinning and melt accumulation make this a target area for a more detailed analysis.