Download
1 / 114
1.14k likes | 1.29k Vues
Diagnosis and Challenges of Infrastructure. Experiences and Lessons from Latin America. J. Luis Guasch, World Bank and University of California-San Diego. Cape Town, South Africa, 29-31 May 2006. Objective: Answer Key Questions. Diagnosis How large is the infrastructure gap?

E N D
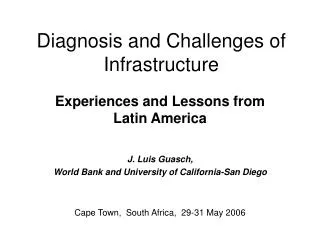
Diagnosis and Challenges of Infrastructure Experiences and Lessons from Latin America J. Luis Guasch, World Bank and University of California-San Diego Cape Town, South Africa, 29-31 May 2006
Objective: Answer Key Questions • Diagnosis • How large is the infrastructure gap? • Why did the gap emerge? • What is the cost-investment needed- of closing the gap? • Impact • On growth/productivity/competitiveness • On poverty and inequality • Moving Forward • What needs to be done? • Role of public vs private-PPPs
What are we doing in Latin America (LAC) ? • Impact Analysis of: • Infrastructure on Growth/Productivity/Competitiveness/Exports/FDI and Poverty • Reforms and Private Sector Participation on Sector/Firm Performance • Forecasting Needs (linked to objectives) • Evaluating the Infrastructure/Investm Gap • Strategies and Policies to close the Gap • Special Attention/Policies for the Poor
A Comprehensive Approach • Put together all the pieces in an homogenous framework • To identify common problems and impacts • Build on existing work but complete the diagnosis • Existing work: on gap, needs, impact, concession design, impact of PPI • Need for more: fiscal space, political economy of private participation, cost recovery • Formulate a regional and country infrastructure strategy • Within existing economic and political constraints
Key Messages • LAC needs to spend more on infrastructure • LAC needs to spend better • Governments remain at the heart of the infrastructure challenge • State Owned Enterprises need to improve performance and sector reform are needed • The private sector can contribute, but lessons from the experience need to be applied
Latin American Infrastructure Stocks Lag Behind East Asia Notes: Infrastructure stock index includes paved roads, electricity generating capacity and telephones (main lines and mobile) per worker. The index is calibrated so that East Asian Tigers had a value of 1 in 1980. Source: Calderon and Serven 2004.
LAC has Fallen Behind China and Middle Income Countries Source: World Development Indicators
What Happened? Public retrenchment never fully offset by private entry Source: Calderon and Serven (2004)
How Much is Needed Depends on the Goal (Fay and Yepes 2004) • Universal coverage of water and sanitation? • ~ 0.25% of GDP over 10 years • To maintain and rehabilitate existing assets? • ~1% of GDP for adequate maintenance • Impossible to estimate rehabilitation needs • For business as usual? • ~ 2% of GDP to satisfy consumer and firm demand based on modest growth assumptions • To grow and take off? • ~4% to 6% of GDP to catch up with Korea and keep up with China
Who Pays?Users and Taxpayer • Users • Cost recovery higher in LAC than in other developing regions – but still low • Implications: • Improve payment culture – government must support enforcement of payment requirements • Protect those who really cannot pay (less than 10% of households in most countries) – well targeted subsidies • Taxpayers: • Where cost recovery is limited • Where there are externalities (social, economic)
The Costs are very High • Lost competitiveness : • 58% of firms in LAC rate infrastructure a major problem vs 18% in East Asia • High logistics cost: 25c of every dollar of product exported (vs. 9c in OECD) • Foregone growth: • Infrastructure gap explains a third of the income gap with East Asia • Hampering fight against poverty • Directly: 75 million without potable water, 116 million without adequate sanitation, 56 million without electricity • Through inequality: raising stock and quality of LAC infrastructure to Korea level would decrease Gini by 5 to 20 points
Issues About PPI • PPI’s impact mostly positive: • Coverage, quality and efficiency have increased significantly • No evidence it increased inequality • The record on unemployment is mixed, sector vs firm, • But, issues of transparency, fairness and capture of rents, and better contract design need to be addressed
Infrastructure Deals with Private Participation have Declined Shows total value of projects with PPI. Source: World Bank PPI database
LAC Needs to Spend Better- To increase value of investments-To capture a larger share of the benefits
Better Expenditure Allocation • New investments must focus on strategic goals • Tackling bottlenecks but not at the expense of the poor • More needs to be spent on maintenance • High rate of return (Rioja 2003; project evaluations) • Decentralization and participatory planning can help
Better Subsidy Targeting • Central to expenditure efficiency goal: • Large amount of resources: electricity subsidies 1% of GDP in Mexico • Poorly targeted: 95% Guatemalan households, 85% in Honduras benefit from social tariff in electricity • Critical for feasibility of cost recovery tariffs • But difficult • Substantial improvements in consumption subsidies are technically and politically difficult • Connection subsidies may be better as unconnected poor will benefit
Better PPP Framework • Renegotiations (over 50%) are costly • Regulatory risk bids up the cost of capital 2-6% • Contingent liabilities can be ruinous • Mexico toll roads: 1- 1.7% GDP; Colombia: 4% of GDP • Governments have often taken on more risk than necessary • Technical progress can mitigate institutional weaknesses: • Technical – improving regulatory and contract/concession design much: has been learnt, questioning price caps, clear and transparent award criteria, clear mechanisms for contract renegotiations • Institutional – remains difficult: independent regulator, capacity for regulatory enforcement
Governments Remain at the Heart of the Infrastructure Challenge
Responsible for Sector Reform and Regulation • True with or without PPI: • PPI failures often due to governments offloading their responsibilities • Government support critical to payment culture and enforcement • Includes the management of the political economy of reform • Reforms complex, can provoke backlash • Must prevent the gains of one group being perceived as the losses of another (redistribution traps)
Responsible for Social Goals • True with or without PPI • Design and funding are public responsibilities • But private sector can be tapped: output based aid; small scale providers • Critical for poverty goals • Central to success of reforms
Responsible for Financing and Financing Framework • Direct financing still needed • At the peak, PPI about 1.7% of GDP concentrated in a few sectors and a few countries • Lack of fiscal space a challenge • Financing frameworks can help • Local currency long term finance or creative financing structure to minimize FX risk • Prudent framework for sub-nationalborrowing • Wholesaling partial risk guarantees
The private sector can contribute, particularly when the lessons from the past are incorporated
Winning Over Public Opinion • Understanding and addressing public discontent with PPI • Required steps: • More transparent transactions • Better contract and regulatory design • Fewer renegotiations • Governments shouldering their responsibilities • On painful reforms • On appropriate safety nets for losers and poor • On perception management
Attracting Back the Private Sector • PPI is risky business • Private operators have not made excess profits • Concessions generally profitable in the long run • Many never profitable (30%) • PPI risk-return ratio can be improved • Decrease regulatory risk and improve PPI framework • Develop risk mitigation mechanisms • Does not mean governments must take on undue amount of risk
IMPACT OF INFRASTRUCTURE (1)ON GROWTH AND ON POVERTY AND INEQUALITYSource: Calderon and Serven (2004)
Infraestructura and Growth The growth costs of the deficiency in infrastructure in LAC. The contribution of infrastructure deficiencies in the output gap vis a vis East Asia countries?
Contributión to the infrastrcuture gap to the gap in output Relative to East Asia (1980-2000, percent) Venezuela Jamaica Nicaragua Ecuador El Salvador Peru Honduras Costa Rica 92% México Guatemala Bolivia Brazil Argentina Colombia Panama Dom. Rep. Infr contribution Uruguay Output gap Chile 0% 20% 40% 60% 80% 100% 120% 140%
Infrastructure and Growth • Economic Implications of Calderon and Serven 2004 estimates • : i. 1 s.d. Infrastructure Stocks and Quality leads to higher growth by 3.6 pp. (2.9 pp attributed to higher quantity and 0.7 pp to higher quality). ii. Raising infrastructure development of Peru (25th percentile) to Chile (75th percentile in LAC), we increase growth by 2.2 pp. (1.7 pp due to larger stocks and 0.5 pp to better quality). Growth Payoff from Infrastructure Development • Growth gains by LAC countries relative to leader (CRI) range from 1.1 to 4.8 pp. • Growth gains of LAC leader relative to EAP median (KOR) is 1.5 pp.
Infrastructure and Inequality • Infrastructure development can have a positive impact on income and welfare of the poor above its impact on average income (Lopez, 2003). • Infrastructure helps under-developed areas to get connected to core economic activities and access to additional productive opportunities. • Infrastructure has a disproportionate impact on the human capital of the poor (education and health), and hence on their job opportunities and income prospects. • Distributive impact of private participation in infrastructure involves micor and macro linkages.
Infrastructure and Inequality • Infrastructure development affects income shares: (a) It reduces the ratio of income shares of top to bottom quintiles. (b) It increases the share of the middle income quintile. Redistributive Benefits of Infrastructure Development • Reduction of Gini coefficient by LAC countries relative to leader in infrastructure development (CRI) range from 0.02 (URY) to 0.10 (NIC). • Reduction of Gini coefficient by LAC leader relative to EAP median (KOR) is 0.03. For countries like GTM, HND, NIC, PER the reduction is greater than 0.1.
Impact of a 12 percentage point reduction of logistic costs (Guasch 2005)
IMPACT OF INFRASTRUCTURE (2) ON PRODUCTIVITY EXPORTS FDI WAGES EMPLOYMENT (FROM ICA SURVEYS) SOURCE: Escribano and Guasch (2005,2006)
Methodology, Data and Estimation (Escribano and Guasch 2005) Investment climate indicators are used to explain the relative competitiveness (productivity or technical efficiency) of firms in the Investment Climate Survey. The significance and the robustness of their explanatory power across different specifications were assessed by comparing the results obtained from the following pooled OLS regressions: Yit is a log measure of output of firm i in period t (t=2000 - 2002), CD is a standard Cobb-Douglas specification (linear combination of log-inputs), TL is a standard translog specification (second-order polynomial of log-inputs), CTR is a set (vector) of control variables (not easily affected by managerial or public policy decisions), IC is a vectorof “investment climate” variables (that can be potentially affected by such decisions), j is an industry index,and is a vector of input coefficients equal to input shares in total cost (under the constant returns to scale assumption).
Methodology, Data and Estimation (con’t) Regressions (1) and (2) are standard production function regressions with vectors CTR and IC added as explanatory factors for TFP. An alternative, two-step, approach would be to estimate TFP as the residual of a standard production function (where output depends only on inputs, i.e. labor, capital and, depending on the definition of the output, materials) – and then regress that residual on vectors CTR and IC. However, this approach is likely to suffer from an omitted variable bias, as the estimated input coefficients may be affected by CTR and IC (see Escribano and Guasch (2005) for a detailed discussion). Therefore, the residual from the standard production function is modeled as a linear combination of CTR and IC variables – and this combination is directly included into the TFP regressions. Regression (3) has a non-parametrically estimated (basically, a calculated) TFP measure on the left-hand side. The reason here is, again, that the input choices may be correlated with the residual - and the non-parametric TFP estimation is another way to avoid that. Finally, (4) has a technical efficiency measure, TEFF, on the left-hand side. For technical reasons, estimation of this measure was done separately (i.e., at the first stage).
Productivity Gains from a 20% Improvement in Selected Investment Climate Variables (%) Source: Escribano and Guasch. (2005).
IMPACT OF SECTOR REFORMS AND PRIVATE SECTOR PARTICIPATION (3) ON SECTOR PERFORMANCE: PRODUCTIVITY COVERAGE QUALITY OF SERVICES PRICES SOURCE: Guasch (2004) and Andres, Foster and Guasch (2006)