Download
1 / 11
110 likes | 232 Vues
Entergy is tackling significant challenges in rebuilding utility infrastructure in a region where over 19,000 megawatts of new generation power is already in operation. Rising natural gas prices have severely impacted fuel costs in Louisiana, where natural gas powers a majority of generation. With only 40% of power derived from stable sources like coal and nuclear, Entergy is focused on harnessing market opportunities to reduce fuel costs and improve efficiency. The utility also faces high storm restoration costs, emphasizing the need for strategic disaster relief solutions.

E N D
Rebuilding Utility Infrastructure:Challenges and Opportunities
Growing Merchant Capacity in Entergy’s Control Area More than 19,000 Megawatts of New Generation is Already Operating in Entergy’s Area Source: Internal Analysis
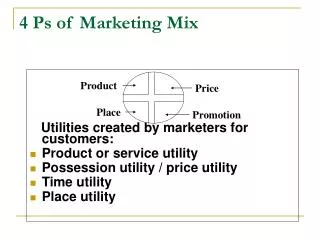
Louisiana’s Fuel Costs AreDriven by Natural Gas Prices Recent fuel cost increases in Louisiana have been caused by skyrocketing natural gas prices. A majority of Louisiana’s generating output was fired by natural gas. Only about 40% of Louisiana’s generating output was fired by stable fuel sources such as coal or nuclear. AL AR FL GA LA MS SC TN TX Source: Energy Information Administration, Department of Energy and Platts (adjusted at CPI-U per Bureau of Labor Statistics, U.S. Department Of Labor)
Market Opportunities Lower Generation Costs We have reduced our dependence on older, less efficient gas resources… … via market opportunities, reducing the implied heat rate, lowering fuel costs. Gas/Oil and Purchases Heat Rate Improvement (Btu/KWh) Illustrative Illustrative
Annual Energy Productionby Source Reflects Progress 2004 was characterized by the most nuclear production ever, the most coal production ever, the most purchased power ever, and the least gas & oil production ever These efforts are allowing Entergy to lower its fuel costs for customers.
Storm Restoration Cost * Based on Jan 19, 2006 Earnings Release
Estimated Restoration Costs per Customer The scope of costs are incredible by nearly any measure. What is most striking is that the costs per customers are many multiples of the total costs for the four storms that ravaged Florida in 2004. Estimated Restoration Cost Cost Per Customer 7.0x 13.6x 14.3x 6.3x 5.1x ENO ELI CLECO EGS-LA EMI 2004 Florida Storms
Recovery Initiatives • Insurance Coverage - $400M Oil Insurance Limited $250M AIG/Lloyd’s $150M • Federal Relief Community Development Block Grants • Rate Relief
Use of CDBG Funds • Governmentally-owned (munis) and private non-profit (coops) electricity providers are eligible for Federal disaster relief assistance under the Stafford Act. Investor owned utilities are not. • This disparate treatment is unwarranted. • CDBG has been used on occasion to fund a variety of disaster relief costs that were ineligible under the Stafford Act • CDBG provided assistance to New England investor-owned utilities after 1998 Ice Storms, and to Con Edison after the 9/11 terrorist attack. • Mississippi plans to use CDBG funds for disaster relief to investor owned electric utilities.
Media Treatment The Clarion-Ledger, Jackson, MS