Indifference Curves and Utility Maximization
200 likes | 1.12k Vues
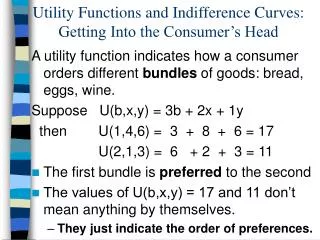
Indifference Curves and Utility Maximization. CHAPTER 6 Appendix. © 2003 South-Western/Thomson Learning. Indifference Curves and Utility Maximization. Marginal utility analysis requires some numerical measure of utility in order to determine the optimal consumption combinations

Indifference Curves and Utility Maximization
E N D
Presentation Transcript
Indifference Curves and Utility Maximization CHAPTER 6 Appendix © 2003 South-Western/Thomson Learning
Indifference Curves and Utility Maximization • Marginal utility analysis requires some numerical measure of utility in order to determine the optimal consumption combinations • Economists have developed another, more general, approach to utility and consumer behavior • This approach does not require that numbers be attached to specific levels of utility
Indifference Curves and Utility Maximization • All this new approach requires is that consumers be able to rank their preferences for various combinations of goods • Specifically, the consumer should be able to say whether • Combination A is preferred to combination B • Combination B is preferred to combination A. or • Both combinations are equally preferred
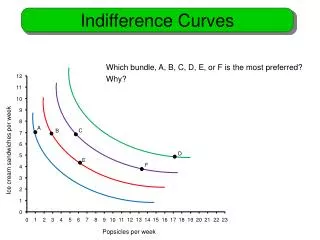
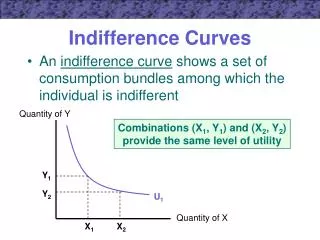
Consumer Preferences • Indifference curve shows all combinations of goods that provide the consumer with the same satisfaction, or the same utility • Thus, the consumer finds all combinations on a curve equally preferred • Since each of the alternative bundles of goods yields the same level of utility, the consumer is indifferent about which combination is actually consumed
Indifference Curves • For a person to remain indifferent among consumption combinations, the increase in utility from eating more pizza must just offset the decrease in utility from watching fewer videos • Thus, along an indifference curve, there is an inverse relationship between the quantity of one good consumed and the quantity of another consumed indifference curves slope down
Indifference Curves • Indifference curves are also convex to the origin they are bowed inward toward the origin • The curve gets flatter as you move down it • The marginal rate of substitution, or MRS, between pizza and videos indicates the number of videos that the consumer is willing to give up to get one more pizza, while maintaining the same level of total utility
Marginal Rate of Substitution • The MRS measures the consumers willingness to trade videos for pizza depends on the amount of each good the consumer is consuming at the time • Mathematically, the MRS is equal to the absolute value of the slope of the indifference curve • For example, in moving from combination a to combination b, the consumer is willing to give up 4 videos to get 1 more pizza slope between these two points equals –4 MRS = 4; from b to c, MRS = 1
Marginal Rate of Substitution • The law of diminishing marginal rate of substitution says that as a persons consumption of pizza increases, the number of videos that they are willing to give up to get another pizza declines • This implies that the indifference curve has a diminishing slope as we move down the indifference curve, the consumption of pizza increases and the marginal utility of additional pizza declines
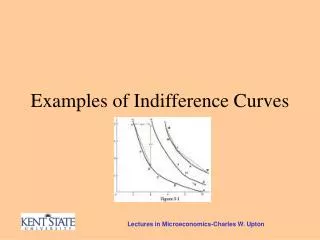
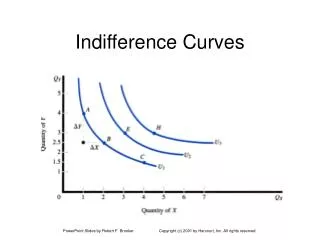
Indifference Map • We can use the same approach to generate a series of indifference curves, called an indifference map graphical representation of a consumer’s tastes • Each curve in the map reflects a different level of utility
Properties of Indifference Curves • A particular indifference curve reflects a constant level of utility the consumer is indifferent among all consumption combinations along a given curve • If total utility is to remain constant, an increase in the consumption of one good must be offset by a decrease in the consumption of the other good indifference curves slope downward • Higher indifference curves represent higher levels of utility
Properties of Indifference Curves • Because of the law of diminishing marginal rate of substitution, indifference curves are bowed in toward the origin • Indifference curves do not intersect • Indifference curves are a graphical representation of a consumer’s tastes for the two goods
Properties of Indifference Curves • Once we have the consumer’s indifference may, we turn to the issue of how much of each good will be consumed? • To answer this question, we must consider the relative prices of the two goods and the consumer’s income
Budget Line • Budget line depicts all possible combinations of movies and pizzas, given prices and your budget • Suppose movies rent for $4, pizza sells for $8, and the budget is $40 per week if you spend the entire $40 on videos, consumer can purchase 10 videos, and if on pizzas person can afford 5 per week
Summary • The indifference curve indicates what the consumer is willing to buy • The budget line shows what the consumer is able to buy • When the indifference curve and the budget line are combined, we find the quantities of each good the consumer is both willing and able to buy
Consumer Equilibrium • Consumer equilibrium occurs where the slope of the indifference curve is equal to the slope of the budget line • Recall that the absolute value of the slope of the indifference curve is the marginal rate of substitution, and the absolute value of the slope of the budget line equals the price ratio
Consumer Equilibrium • Thus, • MRS = Pp / Pv • Further, the marginal rate of substitution of pizzas for video rentals can be found from the marginal utilities of pizza and video MRS = MUp / MUv
Consumer Equilibrium • In fact, the absolute value of the slope of the indifference curve equals MUp/MUv and the slope of the budget line equals pp / pv the equilibrium condition for the indifference curve approach can be written as
Effects of a Change in Price • What happens to the consumer’s equilibrium consumption when there is a change in price? • The answer can be found by using indifference curve approach to derive the demand curve
Income and Substitution Effects • The law of demand was initially explained in terms of an income effect and a substitution effect • With indifference curve analysis we have the analytical tools to examine these two effects more precisely