Download
1 / 15
150 likes | 277 Vues
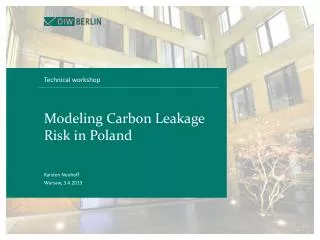
Technical workshop. Karsten Neuhoff. Warsaw , 3.4.2013. Modeling Carbon Leakage Risk in Poland. Avoid job and emission leakage. Untill 2020 with free allocation, then revisit options. 50%. Casting of iron. Lime. Preparation of yarn. 40%. Allocation dependent (direct) CO 2 costs / GVA.

E N D
Technical workshop Karsten Neuhoff Warsaw, 3.4.2013 Modeling Carbon Leakage Risk in Poland
Avoid job and emission leakage Untill 2020 with free allocation, then revisit options 50% Casting of iron Lime Preparation of yarn 40% Allocation dependent (direct) CO2 costs / GVA Copper Electricity (indirect) CO2 costs / GVA Other textile weaving Household paper Flat glass Other inorganic basic chemicals 30% Veneer sheets Non-wovens Retreading/ rebuilding tyres Industrial gases Coke oven Potential Maximum Value at Stake (MVAS) and Net Value at Stake (NVAS) Rubber tyres & tubes manufact. Aluminium Fertilisers & Nitrogen Malt 20% Starches& starch products Cement Hollow glass Basic iron & steel Based on Climate Strategies work from 2007, verified with recent data Finishing of textiles 10% Refined petroleum Pulp & paper 4% 2% 0% UK GDP 0.2% 0.4% 0.6% 0.8% 1.0% Value of free allocation relative to cost of emission 2009 Industrial activities with the highest cost increase from carbon pricing, and their contribution to UK GDP, assumed carbon price increase 20 €/t CO2, electricity price increase 10 €/MWh. Only sector with more than 0.5 Mill. tonnes CO2/EU27 added by Commission: Other organic chemicals (NACE 2414)
Value chain of concrete production Illustrative for UK 70% 60% Cement Concrete products (concrete products Clinker for construction; mixed concrete etc) 50% Total cost increase 40% Cost increase relative to value added (20 €/t CO2) Cost increase passed on from first production stage (clinker) 30% 20% Cost increase from higher electricity prices 10% 0% 0 500 1000 1500 2000 2500 3000 3500 Cumulative gross value added (mio €) Source: Climate Policy after Copenhagen – The role of Carbon Pricing, Cambridge University Press 2011
Value chain of steel production using BOF process Illustrative for UK 50% Iron and steel Hot rolled Semi finished 40% Total cost increase from CO2 pricing 30% Cost increase from passed on CO2 pricing of first production stage only Cost increase relative to value added (20 €/t CO2) 20% Total cost increase from higher electricity prices 10% 0% 0 500 1000 1500 2000 2500 3000 Cumulative gross value added (mio €) Source: Climate Policy after Copenhagen – The role of Carbon Pricing, Cambridge University Press 2011
Distortions from different C-efficiency in EU countries? Source: TNO – Greenhouse gas efficiency of industrial activities in EU and Non-EU
Leakage concerns differ accross sectors Potential leakage channels illustrated at the example of some potentially effected commodities
Main options to address leakage for sectors with concern Regenerativwirtschaft im europäischen Verbund?
Focus use of measures to address leakage 2. Limit scale to emissions of best available technology 4. Limit how far down the value chain 1.Limit to com-modities with leakage risk 3. Limit to costs incurred from tax / allowance auction
Energy intensive products Polandcurrenttlynet-importerfromrestof Europe Additional investmentpre-emptedbyimports from ROE New investmentifproduct/processrequirementschange Thenlikelyclosetodemand -> Poland -> Crediblevisionisnecessary Regenerativwirtschaft im europäischen Verbund?
The Need for European Perspective for Investment Other regions accelerate implementation of carbon pricing EU ETS WCI (2013) RGGI Korea (2015?) Tokyo PRChina (2013?) Taiwan (201x?) South African Carbon Tax Australian ETS 2012 NSW NZ ETS Graph: Left: Michaelowa et a., right: Andreas Türk, Sonja Klinsky, Michael Mehling, Xin Wang 2012, Climate Strategies
1,400 Denmark 1,200 Japan 1,000 Norway Best fit constant price Austria a elasticity of -1.0 Italy 800 Germany Average energy price US$/t oil equivalents Luxembourg Switzerland Sweden Portugal Finland France 600 Spain New Zealand Netherlands Hungary United States Greece Turkey Australia 400 Korea Slovakia Mexico United Czech Republic Canada Poland 200 Kingdom Belgium 0 0.0 0.1 0.2 0.3 0.4 0.5 0.6 0.7 0.8 0.9 1.0 Average energy intensity (kg oil equivalent/US $1995 GDP) Economy wide – energy prices drive efficiency Source: Newbery, D. M. (2003). Sectoral Dimensions of Sustainable Development: Energy and Transport. Economic Survey of Europe 2: 73-93 Regenerativwirtschaft im europäischen Verbund?
Macro impact – replacing fuel imports with local activity Fuel import costs relative to GDP (2011) Source: Based on BP Statistical Review of World Energy June 2012 Assuming average gas price matches average oil price (most LT gas contracts track oil price with 6 months lag)
Employment in Renewables – driver in Germany Total Wind Power 382.000 (2011) 101.000 (2011) Solar Bio Mass 124.000 (2011) 125.000 (2011) Philip Ulrich [GWS] Martin Distelkamp [GWS] Dr. Ulrike Lehr [GWS] Dr. Peter Bickel [ZSW] Andreas Püttner [ZSW] (2012) Erneuerbar beschäftigt in den Bundesländern, Bericht zur daten‐und modellgestützten Abschätzung der aktuellen Bruttobeschäftigung in den Bundesländern
Benefits of an integrated European approach Founding members Joining during 20th century Joining 2004 GDP growth 2007 9% 6% 3% 0% g g g g g g g g g g g g 3 4 3 n n n n n n n n n n n n 7 0 7 9 0 9 i i i i i i i i i i i i 5 4 4 4 4 7 5 5 4 4 4 4 7 3 6 5 4 5 5 4 4 4 7 3 6 4 4 4 7 4 3 6 4 1 4 6 4 1 3 d d d d d d d d d d d d 1 2 1 9 0 0 9 9 0 0 0 9 0 9 9 0 0 0 0 0 0 0 7 8 0 0 0 7 8 8 0 8 0 0 0 7 8 8 7 0 0 0 n n n n n n n n n n n n -3% 0 9 0 0 9 9 0 0 0 0 0 9 9 9 0 0 0 0 0 9 9 9 9 0 9 9 0 0 0 0 0 9 9 9 9 0 0 0 0 a k k u u u u u u u u u u u u 1 2 2 2 1 1 2 2 2 2 2 1 1 2 1 1 2 2 2 2 1 2 2 2 2 2 1 1 2 1 1 2 1 2 1 1 1 2 2 o o o o o o o o o o o o r r i n a a F F F F F F F F F F F F m s a a m a a a a s a a a a a a a a a a a c e c e d n y d d n d n y d d n e m m l l a a u u c c e e n n n n n n i i m m g s s g r r e v e i i i i i i i i i i i i i i i y y y y t i i t g g n n n n n n a n a k v k v a a l l o r r o r r b e b e l l n n a a a a a a a a d d a a r d r d o n n c c a a l l u a u a a a r r e t t o g o g p p a a p p t d t d s s e e u u u u e e u u a a g g e e M M n n n n a a S S S v l v l l l m l m l l u u v e e n n o n o n u u y y g g D D t t L L t t t t p p o o m m a a a a r r s w s w i i C C o o G G g g l l P P r r o I I A A u h h u u u E E n n r r F F o o i i e e b b o o S S S B r r S B l l I I H H l S l l F F l P R R P l e e R R r r t t K K m m i i r r e e e e i i L L B B G G h h -6% h h e e d d c c x x t t e e e e e e u u N N t t z z L L i i C C n n U U 1985 - 1994 1995 - 1998 1999 - 2003 2004 - 2007
Karsten Neuhoff kneuhoff@diw.de