Download
1 / 29
290 likes | 404 Vues
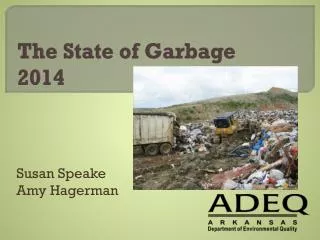
This report provides an in-depth analysis of the state of garbage management in Arkansas from 2014, highlighting data from Regional Solid Waste Management Districts (RSWMDs) and the Arkansas Department of Environmental Quality (ADEQ). It assesses current operations, waste composition, and recycling practices, as well as gaps in services. The document outlines future priorities, administrative structures, and legislative recommendations for evolving the Solid Waste Management Plan. It emphasizes the importance of stakeholder engagement and continued assessment to effectively manage solid waste in the state.

E N D
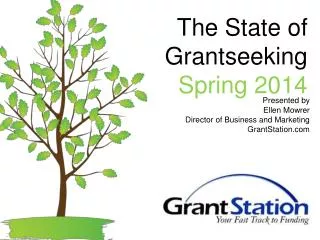
The State of Garbage 2014 Susan Speake Amy Hagerman
Our data • The present • From Regional Solid Waste Management Districts • ADEQ records • Future Priorities • Developing subcommittees, Solid Waste Management Plan • Legislative recommendations
Definitions • Regional Solid Waste Management Districts – RSWMDs • 18 multi- or single-county districts • Responsible for geographic SW management
Definitions • Solid Waste Management Plan • Guideline for RSWMD to follow in Solid Waste planning • Revised every 10 years • Needs Assessment completed and Subcommittees developed goals with an action plan
Needs Assessment • Completed by each RSWMD to facilitatethe SW Plan revision • The Needs Assessment details • Existing Services • Current Operations • Identified Gaps
2013 Needs Assessment Plan area Administrative structure Waste origin, composition and characterization Waste collection, recycling and disposal
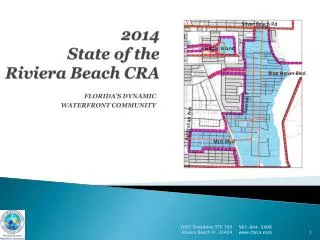
1. Plan Area - Census Most Growth by % in 2020 Least Growth by % in 2020 • Mississippi Co. RSWMD -10.6% • East Arkansas RSWMD - 8.5% • SE Ark. RSWMD - 6.9% • Benton Co RSWMD 44.3% • Faulkner Co RSWMD 31.6% • Saline Co RSWMD 28.2% • Both growth and reduction are factors in planning. Arkansas is expected to grow 8% by 2020.
2. Administrative Structure • Structure determines: • daily activities • decision-making by board, staff • input by others • funding • District structures vary
2. Admin Structure - Funding Districts have both statutory requirements and optionsfor funding Recycling grant program disbursement changed, Act 1333 Tire and e-waste programs unchanged
3. Waste Origin, Composition, and Characterization 85% of Arkansas’s waste stream is MSW Only 6% of thewaste stream leaves the state.
Recyclables • Over 70% of landfill waste is recyclable, says EPA • Big 3: • paper • food scraps • yard trimmings
Daily individual MSW production 9.47 lbs 4.43 lbs • After recycling, Arkansas’s landfill disposal rate still rose 9% in the last six years.
4. Waste Collection, Recycling, and Disposal Class 1 landfills Graph 4.1.2
4. Waste Collection, Recycling, and Disposal Class 4 landfills
Arkansas Recycling Rate *Recycle amounts include Industrial and district reporting *Recycle amounts include Industrial and district reporting
Facilities *Seven RSWMDs have no permitted composting facilities.
Collection Systems and Service Providers • Collection systems differ by county • Contracts with private haulers • Or individuals select their own service • State lacks curbside service and composting facilities • Deficient multi-family recycling impacts 7% of state
About the 2013 Needs Assessment • Information received was incomplete regarding: • Industrial Surveys • Specific services by city/county • Projected needs • Insufficient data hinders accurate planning for SW management
The state plan forward • Subcommittees developed goals for the districts to use in the next decade • Entity responsible for implementation • Goal or Mandate • Regulation changes and/or funding • Measurements
Subcommittee 1 • Needs Assessment • Waste diversion • Reporting time frames • Annual reports
Subcommittee 2 • Collection • Curbside/roadside or drop-off • Semi-monthly yard waste collection • Bulky item services
Subcommittee 3 • Disposal • Landfill capacity • Waste audits • Permitting process • HHW programs • Material bans from landfills
Subcommittee 4 • Recycling • Expand material categories • Cities 5000+ offer curbside recycling • Special events
Subcommittee 5 • Special Recoverable Material • Committees/Workshops for alternatives • Material directory • Thermal Recovery • Due diligence • Illegal dump program
Subcommittee 6 • Education and Public Participation • Statewide media campaign • Updated website • Community partnerships