Download
1 / 27
270 likes | 428 Vues
State of the Waterway 2014. Steven W. Nerheim Director, VTS Houston/Galveston. February 7, 2014. U.S. Department of Homeland Security United States Coast Guard. U.S. Port Rankings – 2011. (Millions of short tons and % of change from 2010 ACOE data.). U.S. Port Rankings - 2012.

E N D
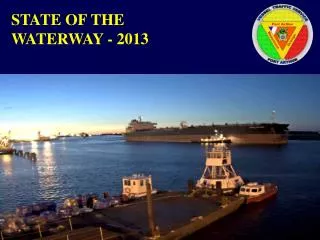
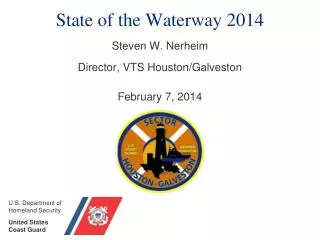
State of the Waterway 2014 Steven W. Nerheim Director, VTS Houston/Galveston February 7, 2014 U.S. Department ofHomeland Security United StatesCoast Guard
U.S. Port Rankings – 2011 (Millions of short tons and % of change from 2010 ACOE data.)
U.S. Port Rankings - 2012 (Millions of short tons and % of change from 2011 ACOE data.)
1999 – 2013 Transits 22.68% increase over 15 years Trend line represents 5 year moving average.
Deep Draft Tethered Movements Draft restricted to 43’ June 14 thru December 22.
Incident Summary - 2013 264 Incidents (142 for 2012) up 85.9% • 214 Vessel Casualties +193.2% • 30 Groundings -11.8% • 6 Collisions -45.5% • 2 Allisions -66.7% • 12 Other -33.3% • Broken Face wires / coupling, Person in Water, Fire, Barges adrift, Person in Water, Pollution / Spill
Vessel Casualties - Year to Year • 214 Total Vessel Casualties • 119 Ship • 86 Tow • 8 Other
Groundings – Year to Year Reported causal factors: • Current • Wind • Operator Error • Surge by another vessel • Weather • Tide • Unknown
Allisions • 2 Allisions • 1 involving a tow • 1 involving a ship
Collisions • 6 Collisions • 4 ship/tow • 1 tow/tow • 1 tow/pc
Hotspots Grounding Allision Collision
Reports of Unsafe Moorings(Slack Lines) • Decrease of 17.51% • Average speed of vessel reported causing damage or parted lines 5.8 kts with no vessel speed greater than 6.8 kts
ATON Knockdowns - 2013 • 92 Total knockdowns • 29 Self-reported knockdowns(31.5% of total knockdowns) • Leading Causes: • 50% - Wind/Current • 40% - Traffic Density • 20% - Operator Error
Industry Involvement • NavOps Committee • Fleeting • Vessel Casualty • Slack Line • COC Boarding Issues • Waterways Safety • Lay Berth • Anchorage Drafts • Additional Anchorages • Dredging Coordination • Education and Outreach
On the Horizon • Expanding traffic (both size and volume) • New / expanded facilities • Change in workforce demographics • Move to Ellington
Contacts • VTS Houston/Galveston www.uscg.mil/vtshouston • Vessel Traffic Center • Watch Supervisor (24 hrs) 281.464.4837 houstontraffic@uscg.mil • Director: • Steve Nerheim 281.464.4826 steven.w.nerheim@uscg.mil • Deputy Director: • Warner Welch281.464.4827 richard.w.welch@uscg.mil • Operations Officer • LT Randy Scott 281.464.4829 michael.r.scott@uscg.mil
U.S. Department ofHomeland Security United StatesCoast Guard