Download
1 / 1
10 likes | 171 Vues
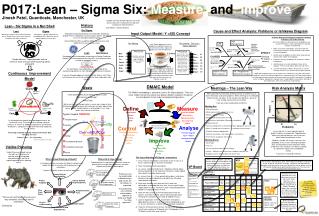
P017:Lean – Sigma Six: Measure and Improve. Jinesh Patel, Quanticate, Manchester, UK. “Quality can truly change GE from one of the great companies to absolutely the greatest company in world business.” - Jack Welch – General Electric. History . Lean - Six Sigma in a Nut Shell. Six Sigma

E N D
P017:Lean – Sigma Six: Measure and Improve Jinesh Patel, Quanticate, Manchester, UK “Quality can truly change GE from one of the great companies to absolutely the greatest company in world business.” - Jack Welch – General Electric History Lean - Six Sigma in a Nut Shell Six Sigma Originally founded by Motorola in the early 80’s headed by George Fisher at Motorola's Communicators Sector. Developed in a crisis attempt to improve quality. General Electric (GE) saved $12 billion over five years and added $1 to its earnings per share. Lean Developed from the concepts comprising the Toyota Production System (TPS) and named in the early 90’s. Lean practices have existed for hundreds of years. The techniques have widely been used outside of the manufacturing processes from Hospitals to Financial institutions. From the Drug development industry Eli Lilly, Merck, J&J, Pfizer and Covance are just a few companies to have made direct cost savings. Cause and Effect Analysis: Fishbone or Ishikawa Diagram Lean Maximise customer value while minimising waste. Simply, lean means more value for customers with fewer resources. Sigma Six Sigma is a quality improvement methodology with a particular goal of reducing defects to near zero. Input Output Model: Y =f(X) Concept • Fishbone Diagram Showing Cause and Effect Analysis of Delays in PK Output Delivery. • Aim of the model is to find root causes of problems and visualise the process from all perspectives allowing solutions to be derived. • Make sure all the stakeholders are present who are involved in the process to allow all views to be voiced (use a white board). • Briefly name the problem or effect to be analysed and write it at the “Head” of the diagram. • Determine the key contributors to the process. Add to the diagram. • Add the processes each contributor makes to the diagram; These can be broken down into sub-levels. • Use the Risk Analysis Matrix / Brainstorm as a team outlining the key issues and how they maybe resolved. Data Management Tea Making Tea making - The Lean – Sigma Approach CRF Lean Lean Sigma approaches can be applied to any product, process or service that transforms inputs into outputs by some definable way. Data Not Merged Correctly / Matching Specification Lack of input relevant team ie PK representative EFFECT Delayed PK outputs delivery Incorrect Merging Applied 6s PROCESS PROCESS Poor CRF Design Process unclear. Core check not identified / performed 3.5 mins 5 mins Milk - X1 Water - X2 Tea - X3 Spoon - X4 Kettle - X5 Mug - X6 Sugar - X7 Boil Kettle with 1 cup (200mls) of water (2min to boil). Utilise this time e.g. toilet break etc. Add tea bag to mug, add sugar cubes to reduce variation in sugar content, add water, brew tea for optimal / consistent time (40secs), add measured amount milk and stir the optimal number of times. Milk - X1 Water - X2 Tea - X3 Spoon - X4 Kettle - X5 Mug - X6 Sugar - X7 Lack of training. Knowledge not shared within DM teams CAUSES Boil kettle , get mug, add tea bag, add sugar, add water, brew tea, add milk and stir. Output Y1 Combined Lean - Sigma provides tools to minimise waste and cost while improving speed and quality Samples incorrectly labelled damaged Change in process from previous study conducted Deadlines not clear and data poor quality Data not Received / Delivered Under resourced Lack of Communication Between Programming and PK Representative With a small amount of process analysis you can apply Lean Sigma six principles to a “cuppa tea”. Improving the consistency and quality of the tea whilst reducing time and cost. Almost everything we do can be broken down and analysed. See what you can improve in your life. Data not sent to Third party Missed Deadline ContinuousImprovement Model 6s Interim + Final data requests PK / Programmer / Statistician Analysis Looking at the diagram you can see there are a number of issues and a lot of team contributors working in different departments. Implementing Visual Planning techniques can help improve communication and show clearly where all the interactions / handovers occur. A step by step process map with roles, responsibilities and contacts will help to solve bottlenecks (See Visual Planning section below): Waste Meetings – The Lean Way Risk Analysis Matrix Quality Improved Pipeline • When planned and executed, meetings can be an efficient way to share information and solve problems. When meetings are scheduled without reason, too often, or not enough, they become a waste of time, energy and can cause frustration. • Here are a few meeting Dos and Don’ts • Meeting Dos • Short and regular • Meeting ground rules – Team consensus • Agenda - regular meetings • Standardised format anyone can lead • Invite only key stakeholders (Mandatory attendance) • Problem focused • Park non agenda items to end and then plan appropriate course of action • Sigma 7 second rule for responses. (7 second pause for answers) • Schedule meetings appropriately • Summarise outcomes and responsibilities and timelines • A few minutes to appraise the meeting • Meeting Don'ts • Go off topic • Over run • Let any one person dominate the meeting • Lecture – Meetings are for discussion, feedback, questions etc • Avoid discussions of deliverables that are on track “Time waste differs from material waste in that there can be no salvage.” - Henry Ford Hi Waste exists in every organisation in some way, shape or form. Eliminating / reducing waste will make you and your organisation leaner. Quality should improve as a by product. Less steps means less chance of deviation. Types of waste TIMWOOD Transport waste Inventory Motion Waiting Over producing waste Over processing waste Defects PERFORMANCE Impact Leaner Organisation Faster Cycle Times Speed Cost Lo Poor information In the competitive world of drug development costs are constantly rising. The average cost to bring a drug to market is in excess of *£800m. Drug patents are limited to 10-20 years. Companies need to be constantly improving to stay ahead. “Focusing on quality actually reduced cost more than focusing on cost” Jeffery K Liker – ‘The Toyota Way’ *(Journal of Health Economics 2003) Bureaucracy Complexity Hi Lo Probability Re-work is waste Wasted energy & water Overresourced Assessing risk is a very important part of project / process management. Dependencies often exist within processes and issues can often lead to a bottleneck in flow. Conduct a simple risk analysis to assess the probability of any issues affecting the project flow. It is important to hear everyone’s views and discuss why a process has been assigned to a particular impact versus probability section. A consensus should be reached. Waste of skills and knowledge Creativity Future State VSM Brain-Storm Pilot Visible Planning Visible Planning is about turning the lights on. Breaking silo working, and fostering good communication is the key to improving quality whilst reducing waste. • The Visual Planning (VP) Board - Instructions • Ensure all the stakeholders are present at the session or at least a representative is there on their behalf. • Team Introductions and Ice-breakers. • As a team, complete Study Team / Objectives Board. Agree primary objectives of the study. Key milestones maybe added whilst detail should be kept minimal. • As a team think of 3 – 5 key project deliverables / milestones based on the project objectives and add to the VP board under project milestones. • Each team member must write on Post-it notes key deliverables associated with their role. Use the input Output model above to assist. The Post-it notes should be dated with deadline. Assign potential risk level. • Place the Post-it notes on the VP board and review the process and steps involved. Look at how the project flows from process to process. Can value be added? Discuss. • Look for duplication in efforts, wasted time, interactions, dependencies where x1 and x2 need to be completed to start y1. Assess timeframes in which tasks need to be completed. • Hang the VP board where all team members can see. For virtual teams electronic VP boards exist. Photographs of the VP board can be taken and emailed. Where Did it all go Wrong? Production lines in manufacture are much easier to picture whilst Invisible work processes are more difficult to fully identify and improve. What is Visual Planning all About? Visual planning aims to charter the flow of a project and enable the team to visualise all the processes and interactions. Creates Pull within a team to achieve objectives All key study information is present. Primary objectives and endpoints are also included to ensure the project fulfils it’s objectives, and does not turn into exploratory analysis e.g. outputs for the sake of outputs. KEY “Andon” Normal Post-it notes showing Name, Date, Deliverable and Deadline are placed on the VP board. Interactions, overlaps, handovers and dependencies become visible and can be assessed. Joining lines can be drawn on to the VP board to highlight touch points between processes. The team can assess the project flow and eliminate waste. Problem / Risk of Delay Jinesh. P 22-03-2010 INTERIM SAFETY OUTPUTS Deadline 30th May 4pm VP Board Critical Problem Objectives / Deliverables As Described in the SOP Failed Delivery Processes can be understood in different ways and results are not always as expected. Visual planning aims to bring stake holders together to achieve a “Right first time approach.” All critical issues are placed on the issues board and circled with red marker. Name, date the issue is acknowledged and date resolved are all added. The board allows clear summary of study issues and easy source of agenda items to discuss and resolve issues. Study Team / Objectives Project Name XXX-XXX Phase I DLT study – Primary Objective Primary Endpoints – Maximum tolerated dose Team members:Jin, Will, Anne, Simon, Nera , Vaibhav Contact information: XXX xXXX xXXX xxXXX xX xXXX Clearly Defined Accountability Week commencing Jan 1st Feb 8th Mar 15th Jul 1st Aug 18th Oct 15th Nov-24 Issues Clearly Defined Responsibilities Project Visibility Project Milestones SAP / Protocol review CRF sign off 9th Feb Templates sign off 22nd March Interim Review 5th July 2010IND reporting23rd Aug Draft Review Oct 16th xx xxxxxxxxxxx xxxxxx “It is not the strongest of the species that survive, nor the most intelligent, but the one most responsive to change.” - Charles Darwin As Understood by the Programmer Jin - DeliverablesProgrammer Clear Team Roles Review outputs Snapshot Status View Will - DeliverablesStatistician 6s End Result Anne - DeliverablesData Manager “Tell me and I will forget, show me and I may remember, involve me and I’ll understand.” - Confucius New Info / Decisions Xxx x x xx xxx xxxxx xxxx xxxx xxx xxx Simon - DeliverablesPhysician New information / Decision information is recorded, dated and initialled by the team to show who agreed the decision. Project Understanding Key Deliverable Dates What the Client Required Nera - DeliverablesMedical writer Team Interaction and Dependencies Vaibhav - PK PD