Download
1 / 39
430 likes | 658 Vues
Pk/Pd modelling : Clinical Implications. JW Mouton Dept Medical Microbiology Canisius Wilhelmina Hospital Nijmegen, The Netherlands. infections are treated with the same dosing regimen irrespective of the absolute susceptibility of the micro-organism. Susceptible = Susceptible.

E N D
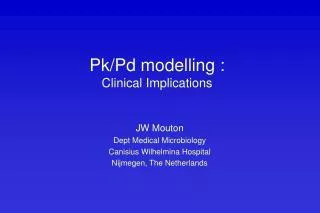
Pk/Pd modelling :Clinical Implications JW Mouton Dept Medical Microbiology Canisius Wilhelmina Hospital Nijmegen, The Netherlands
infections are treated with the same dosing regimen irrespective of the absolute susceptibility of the micro-organism
Susceptible = Susceptible MIC = .016 mg/L MIC = 2.0 mg/L
Pharmacokinetics conc. vs time Pharmacodynamics conc. vs effect 0.4 1 Effect Conc. 0.0 0 0 25 Conc (log) Time 10 -4 10 -3 PK/PD effect vs time 1 Effect 0 0 25 Time Severity Infection Immunesystem
Predictors of Clinical Response Forrest, 1993
AUIC =125 : a magical number?? • PK models : 125 • Animal studies granulocytopenic : 100 • Animal studies immunocompetent : 40 • Human studies: peak/MIC ratio: > 1:10, AUC/MIC
There is a clear relation between pharmacodynamic index and effect. • At some concentration there is a maximum effect • Ideally, a dose should be chosen to obtain a maximum effect
Example Target Controlled DosingIxacin • Patient 60 yr, pneumonia and suspected bacteraemia/sepsis • Ixacin 400 mg IV q8h • Gram negative rod, E-test MIC=0.01 mg/L • Adjust dose to 100 mg/day Mouton & Vinks, PW 134:816
Use of Pharmacodynamics in setting breakpoints • Known concentration effect relationship • microbiology • clinical effect • Standard dose used clinically • pharmacokinetic profile • patient/disease specifics
Quinolones : dose optimalization • Three studies have shown AUC/MIC predictive for outcome • One prospective study Peak/MIC more predictive To peak or not to Peak?
For most quinolones, because of the relatively long half-life, there is a strong correlation between AUC/MIC and Peak/MIC
Pharmacodynamics of fluoroquinolones against Pseudomonas infection in neutropenic ratsDrusano et.al., AAC, 1993, 37: 483-90. • Survival linked to Peak/MIC when ratio > 10/1 • Survival linked to AUC/MIC when ratio < 10/1
! ! ! • Proteinbinding in animals/humans • Duration of treatment • Extended dosing interval • Immune system • Severity of infection • Bacteriological vs Clinical cure
T>MIC: how long??breakpoints • Free fractions of the drug (Fu)? • The same for all micro-organisms? • The same for all beta-lactams? • Efficacy vs emergence of resistance • The same for all infections? • Value in combination therapy? • Variance pk in population? • Static dose vs maximum effect? • If maximum effect, which max effect?
Same all beta-lactams?Same all m.o.? T> MIC for static effect Drug Enterobacteriaceae S. pneumoniae Ceftriaxone (F) 38 (34-42) 39 (37-41) Cefotaxime 38 (36-40) 38 (36-40) Ceftazidime 36 (27-42) 39 (35-42) Cefpirome 35 (29-40) 37 (33-39) MK-0826 32 (20-39) Meropenem 22 (18-28) Imipenem 24 (17-28) Linezolid 40 (33-59)
Predicted efficacy of ticarcillin and tobramycin pseudomonas Mouton ea., aac 1999
Concentration-time profile of beta-lactam Vd = 20 L, Ka = 1.2 h-1, Ke = 0.3 h-1
Monte Carlo Simulation of beta-lactam Vd = 20 L, Ka = 1.2 h-1, Ke = 0.3 h-1, VC=20% 4h 10h Mouton, Int J Antimicrob Agents april 2002
Monte Carlo Simulations in pk/pd (1) • Estimates of pk parameter values and a measures of dispersion (usually SD) • Simulate pk curves based here-on
Target Attainment Rates • Pharmacokinetics of piperacillin • Population pk using npem2 • ‘validation’using classical pk analysis (winnonlin) • Use parameter estimates for Monte Carlo Simulation • Using sd’s only • Using correlation matrix • Obtain TARS at various T>MICs
Monte Carlo Simulations in pk/pd (2) • Estimates of pk parameter values and a measures of dispersion (usually SD) • Obtain covariance matrix or correlation matrix • Simulate pk curves based here-on : • The result will be SMALLER 95% CI because of correlation between parameter estimates
Needed for TAR • Pharmacokinetic profile of the drug • Variation of PK parameters • Estimates of VC • Population analysis, correlation matrix
Cumulative Fraction of Response • TAR at each MIC • Distribution of MICs • Multiply, determine fraction and cum fraction • Beware !!!!! For prediction, a ‘true’ MIC distribution is needed, NOT a biased collection of strains!!!!!
Pharmacodynamic properties of beta-lactams • Efficacy dependent on time above mic • Relatively concentration independent Target for concentration profiles optimizing time > mic Avoid high peak concentrations
Target Concentrationcontinuous infusion • Maximum effect time-kill at 4 x MIC • Maximum effect in vitro model 4 x MIC (Mouton et al 1994) • Effect in endocarditis model 4 x MIC (Xiong et al 1994) • Effect in pneumonia model dependent on severity of infection (Roosendaal et al 1985,86)
Efficacy in Relation to MIC continuous infusion ceftazidime, K. pneumoniae rat pneumonia Roosendaal et al. 1986, AAC 30:403; Roosendaal et al. 1985, JID 152:373
Continuous InfusionPharmacokinetic Considerations • Protein binding • Linear relationship between clearance and dose • Linear relationship between protein binding and dose • Third compartment effects (CNS)
Dose Calculationscontinuous infusion • Total Clearance estimate • Volume of Distribution • Elimination rate constant TBC = Ke x Vd
Normogram Continuous Infusion Mouton & Vinks, JAC 1996
Example Target Controlled Dosingcefticostix • Patient 60 yr, UTI and suspected bacteraemia/sepsis • Cefticostix 1 g IV q8h • Gram negative rod, E-test MIC=0.12 mg/L • Adjust dose to 30 mg/day CI based on patient clearance Mouton & Vinks, PW 134:816
Example Cost Efficiency Continuous Infusion Beta-lactam
Therapeutic Drug Monitoringcontinuous infusion • Clearance estimate • Variable clearance (ICU) • Non-linear clearance