Enhancing Clinical Outcomes Through Modeling: Insights from CHMI, University of Portsmouth
This document outlines the ongoing efforts in clinical outcome modeling led by Dr. Jim Briggs at the Centre for Healthcare Modelling and Informatics, University of Portsmouth. It highlights historical context, the importance of quality clinical data, and our current models which encompass pathology and vital signs. By leveraging reliable data collection methods and advanced statistical techniques, including logistic regression and early warning systems, we aim to improve patient outcomes and reduce preventable deaths in hospitals.


Enhancing Clinical Outcomes Through Modeling: Insights from CHMI, University of Portsmouth
E N D
Presentation Transcript
Clinical outcome modelling Dr Jim Briggs Centre for Healthcare Modelling and Informatics (CHMI) University of Portsmouth
Contents • Background • Clinical data: what's hot and what's not? • What use is a model? • Our models: • pathology • vital signs • latest developments • Impact • Future
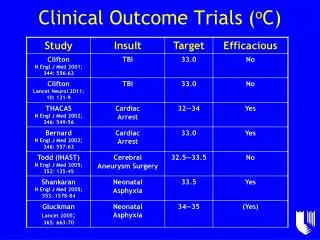
Background • People die in hospitals • [Hogan et al, BMJ Quality and Safety, 2012] study of 1000 adults who died in 10 English hospitals in 2009 • 5% preventable (>50% chance) • = 12,000 per year in England • Recent cases: • Mid-Staffs case is just one of a long history of medical failure • Leeds paediatric cardiac surgery • Often happens because: • a clinician (or team of) is less competent • someone of sufficient expertise sees patient too late • Can data and information technology help?
History of our work • David Prytherch (now visiting Prof) has been involved in outcome modelling since the mid-1990s • Dave joined UoP in 2001 on secondment from Portsmouth Hospitals Trust (PHT) • I got involved shortly thereafter • Dave had previously worked (successfully) on data from surgical cases (P-POSSUM) • Began to look at medicine cases
Clinical data: quality (poor) • Some data in hospitals is poor quality for analysis: • much not stored electronically – therefore not easily accessible • some stored electronically has transcription errors • some not recorded until days/weeks/months after the fact • some is an administrator's judgement (e.g. what an episode is classified as for claims purposes) • some is a clinician's judgement (e.g. diagnosis)
Clinical data: quality (better) • Some data is much more reliable: • most pathology data is taken automatically from quality-controlled testing equipment • and the lab is regularly quality-assured • most test results available in an hour • in Portsmouth, vital signs data is collected regularly at the bedside using portable data entry devices (iPod touch) • very good user interface (reduces data entry error) • data available immediately
Data we have available • Patient administrative data • patient id pseudonymised • age, gender • date/time of admission and discharge • whether admitted as an elective or emergency case • whether discharged dead or alive • which dept(s)/ward(s) the patient was in • Pathology data • 7 most commonly performed tests • Vital signs data • 7 routinely measured physiological indicators
Pathology data used • The "magnificent 7" blood tests: • albumin • creatinine • haemoglobin • potassium • sodium • urea • white cell count • Over 12 months, 9497 patients discharged from "general medicine" • Outcome measured: mortality on discharge • Method: logistic regression
The BHOM model • ln (R / 1−R)= −10.192 + (−0.013 × gender) +(5.712 × mode of admission) +(0.053 × age on admission) + (0.018 × urea) +(−0.001 × Na+) + (−0.101 × K+) +(−0.047 × albumin) + (−0.037 × haemoglobin) +(0.067 × white cell count) + (0.001 × creatinine) +(2.744 × urea/creatinine)
BHOM model evaluated • Two main evaluators: • calibration • does the model reflect the distribution of risk? • most patients are "low" (<5%) risk • discrimination • does the model discriminate between patients who died and those who didn't • AUROC ~ .76
Background to vital sign modelling • 2006-2008 Knowledge Transfer Partnership with The Learning Clinic, developers of VitalPAC • VitalPAC: • allows nurses to collect vital sign data at the patient's bedside • data immediately stored in hospital systems • doctors use a tablet-based interface • Now in use at Portsmouth Hospitals Trust and about 20 other hospitals
Vital sign data used • Another "magnificent 7", vital signs: • pulse • respiration rate • temperature • blood pressure (systolic) • O2 saturation • supplemental oxygen • AVPU score (alert or not)
Early warning systems • Used widely to monitor patient deterioration • Assign "scores" to each parameter • Add them up • If score is above a threshold, take appropriate action, e.g. • increase frequency of observation • call for a doctor • call for a doctor immediately • Most EWSs based on "experience" of a single clinician or a committee of clinicians
ViEWS – VitalPAC Early Warning Score • First EWS based on actual data • Derived from 198,755 observation sets from 35,585 acute medical admissions • Outcome: mortality within 24 hours • Evaluation • discrimination • does the model discriminate between patients who died and those who didn't • AUROC = .888 • Superior to 33 other published EWSs
Method • Initially, trial and error to optimise discrimination • More recently, started using Decision Tree tools to develop models (Tessy Badriyah PhD work) • DT-EWS • DT is a data mining method that produces models that are feasible for humans to apply
Impact • Embodied into VitalPAC • Alerts doctors • Issue is where to set threshold for response • ~20% of obs have score of >=5 (medium alert) • ~10% of obs have score of >=7 (high alert) • Too low a threshold means too much work to do • Too high means you might be too late to save the patient • ViEWS has been adapted by the Royal College of Physicians of England • Now National Early Warning Score (NEWS) and recommended for adoption by all hospitals
Return to BHOM • Could decision trees be used to develop an EWS based on pathology data? • Recent work by Jarvis, Kovacs, et al
Future work • condition-specific models • combined BHOM/vital sign models • other data • other outcomes • multi-centre studies • scale • validation • comparison • commercial exploitation
Acknowledgements • Prof David Prytherch, UoP/PHT • Dr Stuart Jarvis, Caroline Kovacs (current CHMI research team) • Tessy Badriyah (current PhD student) • Prof Gary Smith (Bournemouth University) • Dr Paul Schmidt and Dr Peter Featherstone (PHT consultant physicians) • Dr Paul Meredith (PHT IT) • Dr Mohammed Mohammed (Birmingham U & UoP visiting fellow)
Key references • D R Prytherch, J S Sirl, P Schmidt, P I Featherstone, P C Weaver, G B Smith, The use of routine laboratory data to predict in-hospital death in medical admissions, Resuscitation 2005; 66: 203-207. • D R Prytherch, J S Briggs, P C Weaver, P Schmidt, G B Smith. Measuring clinical performance using routinely collected clinical data. Medical Informatics and the Internet in Medicine June 2005; 30(2): 151-156. • Smith, G., Prytherch, David, Schmidt, P. and Featherstone, P. (2008) Review and performance evaluation of aggregate weighted ‘track and trigger’ systems. Resuscitation, 77 (2). pp. 170-179. ISSN 0300-9572 10.1016/j.resuscitation.2007.12.004 • Smith, G., Prytherch, David, Schmidt, P., Featherstone, P., Kellett, J., Deane, B. and Higgins, Bernard (2008) Should age be included as a component of track and trigger systems used to identify sick adult patients? Resuscitation, 78 (2). pp. 109-115. ISSN 0300-957210.1016/j.resuscitation.2008.03.004 • Smith, G., Prytherch, David, Schmidt, P., Featherstone, P. and Higgins, Bernard (2008) A review, and performance evaluation, of single-parameter “track and trigger” systems. Resuscitation, 79 (1). pp. 11-21. ISSN 0300-9572 10.1016/j.resuscitation.2008.05.004 • Prytherch, D. R., Smith, G. B., Schmidt, P. E., & Featherstone, P. I. (2010). ViEWS — Towards a national early warning score for detecting adult inpatient deterioration. Resuscitation, 81(8), 932-937. • Mohammed, M., Rudge, G., Wood, G., Smith, G., Nangalia, V., Prytherch, David, Holder, R. and Briggs, Jim (2012) Which is more useful in predicting hospital mortality - dichotomised blood test results or actual test values? a retrospective study in two hospitals.PLoS One, 7 (10). e46860. ISSN 1932-6203 10.1371/journal.pone.0046860
jim.briggs@port.ac.uk The End