Download
1 / 9
90 likes | 226 Vues
This resource delves into the application of the t-distribution for constructing confidence intervals when sample sizes are less than 30 and the population standard deviation is unknown. It outlines the properties of the t-distribution, the concept of degrees of freedom, and provides practical examples such as calculating critical values and forming confidence intervals for various scenarios (coffee shop temperatures, car dealership days, and construction costs). Ideal for understanding statistical inference in small sample contexts.

E N D
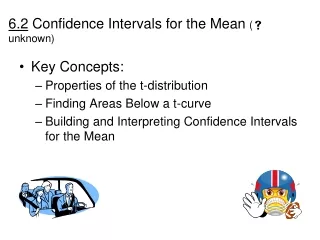
6.2 Confidence Intervals for the Mean (Small Samples) Interpret t-distribution and use a t-distribution table Construct confidence intervals when n < 30, population is normally distributed, and σ is unknown
If the distribution of a random variable x is approximately normal, then follows a t-distribution. t-distribution
The degrees of freedom are the number of free choices left after a sample statistic such as x is calculated. When you use a t-distribution to estimate a population mean, the degrees of freedom are equal to one less than the sample size. d.f. = n - 1 Degrees of freedom
Try it yourself 1 • Finding Critical Values of t Find the critical value tcfor a 90% confidence level when the sample size is 22. Critical value: 1.721
Try it yourself 2 • Constructing a Confidence Interval You randomly select 16 coffee shops and measure the temperature of the coffee sold at each. The sample mean temperature is 162.0°F with a sample standard deviation of 10°F. Construct 90% and 99% intervals for the population mean temperature. Assume the temperatures are approximately normally distributed. 90% CI (157.6, 166.4) 99% CI (154.3, 169.4)
Try it yourself 3 • Constructing a Confidence Interval You randomly select 20 cars of the same model that were sold at a car dealership and determine the number of days each car sat on the dealership’s lot before it was sold. The sample mean is 9.75 days, with a sample standard deviation of 2.39 days. Construct 90% and 95% confidence intervals for the population mean number of days the car model sits on the dealership’s lot. Compare the widths of the confidence intervals. Assume the days on the lot are normally distributed. 90% CI (8.83, 10.67) 95% CI (8.63, 10.87)
Example 4 • Choosing the Normal Distribution of the t-distribution You randomly select 25 newly constructed houses. The sample mean construction cost is $181,000 and the population standard deviation is $28,000. Assuming construction costs are normally distributed, should you use the normal distribution, the t-distribution, or neither to construct a 95% confidence interval for the population mean construction cost? Explain your reasoning. Use a Normal Distribution
Try it yourself 4 • Choosing the Normal Distribution or the t-Distribution You randomly select 18 adult male athletes and measure the resting heart rate of each. The sample mean heart rate is 64 beats per minute, with a sample standard deviation of 2.5 beats per minute. Assuming the heart rates are normally distributed, should you use the normal distribution, t-distribution, or neither to construct a 90% confidence interval for the population mean heart rate? Explain your reasoning. Use a t-distribution