
Confidence Intervals
Explore how confidence intervals work in inferential statistics, terminology, precision, margin of error, and decision-making using examples from large and small samples. Understand the Student’s t Distribution for small samples and when to use z-scores or t-values. Learn to calculate confidence intervals for means, proportions, and sample sizes.

Confidence Intervals
E N D
Presentation Transcript
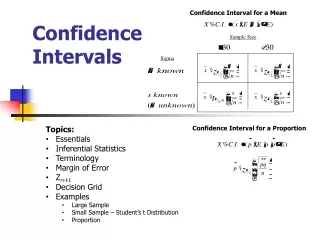
Confidence Interval for a Mean Sample Size Sigma Confidence Intervals • Topics: • Essentials • Inferential Statistics • Terminology • Margin of Error • Za/2 • Decision Grid • Examples • Large Sample • Small Sample – Student’s t Distribution • Proportion Confidence Interval for a Proportion
Essentials:Confidence Intervals(How sure we are.) • Inferential statistics, precision and the margin of error. • Obtaining a confidence interval. • Za/2 • Guinness, Gosset & the Student’s t Distribution • Confidence Intervals for large and small samples, and proportions.
Inferential Statistics: • INFERENTIAL STATISTICS: Uses sample data to make estimates, decisions, predictions, or other generalizations about the population. • The aim of inferential statistics is to make an inference about a population, based on a sample (as opposed to a census), ANDto provide a measure of precision for the method used to make the inference. • An inferential statement uses data from a sample and applies it to a population.
Some Terminology • Estimation – is the process of estimating the value of a parameter from information obtained from a sample. • Estimators – sample measures (statistics) that are used to estimate population measures (parameters).
Terminology (cont’d.) • Point Estimate – is a specific numerical value estimate of a parameter. • Interval Estimate – of a parameter is an interval or range of values used to estimate the parameter. It may or may not contain the actual value of the parameter being estimated.
Terminology (cont’d.) • Confidence Level – of an interval estimate of a parameter is the probability that the interval will contain the parameter. • Confidence Interval – is a specific interval estimate of a parameter determined by using data obtained from a sample and by using a specific confidence level.
Margin of Error, E • The term is called the maximum error of estimate or margin of error. It is the maximum likely difference between the point estimate of a parameter and the actual value of the parameter. It is represented by a capital E.
Obtaining a: Convert the Confidence Level to a decimal, e.g. 95% = .95. Then: Za/2: Areas in the Tails 95% .025 .025 -z (here -1.96) z (here 1.96)
Decision Grid Confidence Interval for a Mean Confidence Interval for a Proportion Sample Size Sigma
t or z???? yes Is Known? Use z-interval formula values no matter what the sample size is.* no Use z-interval formula values and replace in the formula with s (sample std. dev.). yes Is n greater than or equal to 30? no *Variable must be normally distributed when n<30. **Variable must be approximately normally distributed. Use t-values and sin the formula.**
Situation #1: Large Samples or Normally Distributed Small Samples • A population mean is unknown to us, and we wish to estimate it. • Sample size is > 30, and the population standard deviation is known or unknown. • OR sample size is < 30, the population standard deviation is known, and the population is normally distributed. • The sample is a simple random sample.
Consider • The mean paid attendance for a sample of 30 Major League All Star games was $46,970.87, with a standard deviation of $14,358.21. Find a 95% confidence interval for the mean paid attendance at all Major League All Star games. • Have sample mean and standard deviation. • USE:
95% Confidence Interval for the Mean Paid Attendance at the Major League All Star Games
Minimum Sample Size Needed • For an interval estimate of the population mean is given by Where E is the margin of error (maximum error of estimate)
Situation #2: Small Samples • A population mean is unknown to us, and we wish to estimate it. • Sample size is < 30, and the population standard deviation is unknown. • The variable is normally or approximately normally distributed. • The sample is a simple random sample.
Student t Distribution • Is bell-shaped. • Is symmetric about the mean. • The mean, median, and mode are equal to 0 and are located at the center of the distribution. • Curve never touches the x-axis. • Variance is greater than 1. • As sample size increases, the t distribution approaches the standard normal distribution. • Has n-1 degrees of freedom.
Student t distribution with n = 12 Standard normal distribution Student t distribution with n = 3 0 Student t Distributions for n = 3 and n = 12
Confidence Interval for (Situation #2) • A confidence interval for is given by
Consider • The mean salary of a sample of n=12 commercial airline pilots is $97,334, with a standard deviation of $17,747. Find a 90% confidence interval for the mean salary of all commercial airline pilots.
90% Confidence Interval for the Mean Salary of Commercial Airline Pilots
Situation #3: Confidence Interval for a Proportion • A confidence interval for a population proportion p, is given by • Where is the sample proportion . n = sample size and must both be greater than or equal to 5.
Consider • In a recent survey of 150 households, 54 had central air conditioning. Find the 90% confidence interval for the true proportion of households that have central air conditioning. • Here • (NOTE both and > 5)
90% C.I. = .36 ± .065 or 90% C.I. = (.295, .425) or 90% C.I. = (.295 < p < .425) We can be 90% confident that the true proportion, p, of all homes having central air conditioning is between 29.6% and 42.5%
Minimum Sample Size Needed • For an interval estimate of a population proportion is given by Where E is the maximum error of estimate (margin of error)


