
SlideServe
Menu
Préférences
© SlideServe · v2026

CONFIDENCE INTERVALS

leone avatar
28 diapositives · 555 Views · Oct 15, 2014

CONFIDENCE INTERVALS. point estimate : estimate exact value precise likely to be wrong interval estimate : range of values less precise less likely to be wrong. What a Confidence Interval Tells You. 1. Range of values 2. Level of confidence No hypothesis is directly tested.
CONFIDENCE INTERVALS - slide 1
01 / 28CONFIDENCE INTERVALS
1 / 17

Télécharger la présentation

CONFIDENCE INTERVALS
Une image / un lien ci-dessous est fourni (tel quel) pour télécharger la présentation

Politique de téléchargement : le contenu du site vous est fourni TEL QUEL pour votre information et votre usage personnel ; il ne peut être vendu, concédé sous licence ni partagé sur d’autres sites sans l’accord de son auteur.Le contenu vous est fourni TEL QUEL, pour votre information et votre usage personnel uniquement. Téléchargez la présentation en cliquant sur ce lien. Lors du téléchargement, si vous ne parvenez pas à télécharger une présentation, l’éditeur a peut-être supprimé le fichier de son serveur.Pendant le téléchargement, si vous ne parvenez pas à obtenir une présentation, le fichier a peut-être été supprimé par l’éditeur.

F I N

Plus de contenu associé

Transcription de la présentation
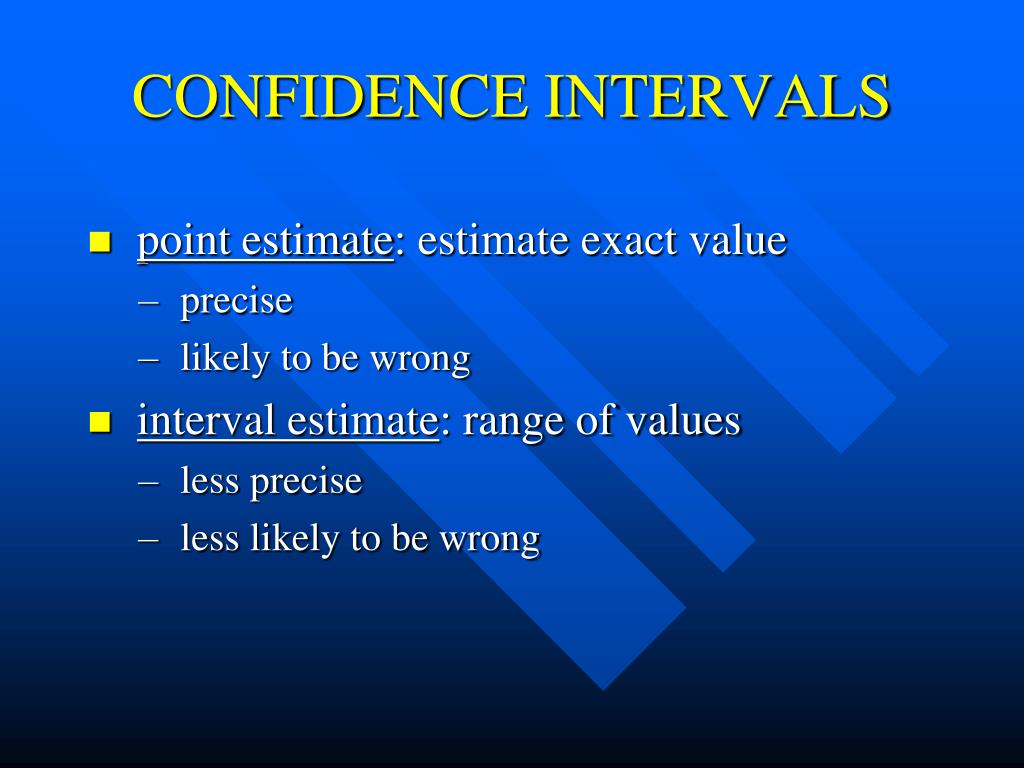
  1. CONFIDENCE INTERVALS • point estimate: estimate exact value • precise • likely to be wrong • interval estimate: range of values • less precise • less likely to be wrong

  2. What a Confidence Interval Tells You 1. Range of values 2. Level of confidence • No hypothesis is directly tested

  3. Confidence Interval with z- scores • Purpose: provide a range of values containing the population mean • Design: any design where a mean is calculated • Assumptions: same as for z-test

  4. How it Works • Start with your sample mean as the middle of the interval. • Establish upper and lower limits depending on how confident you want to be.

  5. lower limit upper limit M

  6. Computation of Confidence Interval with z-scores

  7. Example A sample of 25 students took an aptitude test with a population standard deviation of 40. The mean of the 25 students was 500. Compute the 95% confidence interval for the mean.

  8. STEP 1: Compute the standard error.

  9. STEP 2: Find the z score for your confidence level. For 95% confidence, use z = 1.96 For 99% confidence, use z = 2.58 z = 1.96

  10. STEP 3: Compute the lower and upper limits.

  11. APA Format Sentence The 95% confidence interval for the mean aptitude test score was 484.32 - 515.68.

  12. Confidence Interval with t- scores • Purpose: provide a range of values containing the population mean • Design: any design where a mean is calculated • Assumptions: same as for single sample t-test

  13. Computation of Confidence Interval with t-scores

  14. Example 64 research participants were timed on a motor task. Their mean time was 20 sec, with s = 4.00. Compute the 99% confidence interval for the mean.

  15. STEP 1: Compute the standard error.

  16. STEP 2: Find the t score for your confidence level. Look up two-tailed t in table, using df = N-1, and 1- level of confidence for a. • df = 64-1=63 • a = 1-.99=.01 • two-tailed t = 2.660

  17. STEP 3: Compute the lower and upper limits.

  18. APA Format Sentence The 99% confidence interval for the mean time to complete the task was 20 sec +/- 1.33.

  19. Confidence Interval for a Proportion • Purpose: provide a range of values containing the population proportion • Design: any design where a proportion or percent is calculated • Assumptions: • representative sample • independent observations

  20. Computation of Confidence Interval for a Proportion

  21. Example A sample of 500 registered voters rated how well the President is doing his job. The proportion who gave him a “good” rating was .52, or 52%. Compute the 95% confidence interval for the proportion.

  22. STEP 1: Compute the standard error.

  23. STEP 2: Find the z score for your confidence level. • For 95% confidence, use z = 1.96 • For 99% confidence, use z = 2.58 • z = 1.96

  24. STEP 3: Compute the lower and upper limits.

  25. APA Format Sentence The 95% confidence interval for the proportion of “good” ratings was .52 +/- .04.

  26. Changing the Width of a Confidence Interval • A wider interval is less precise and therefore less informative. • The interval will be narrower with • a larger sample • lower variability • a lower level of confidence

  27. Margin of Error • The media often report poll results and include margin of error. This is the +/- part, usually in fine print. • Add and subtract the margin of error to get the confidence interval

  28. Margin of Error • Can be used as an indirect test of significance • Construct confidence interval around sample statistic using margin of error • If interval includes Ho value, difference is not significant