
SlideServe
Menu
Préférences
© SlideServe · v2026

Understanding Confidence Intervals: Debunking Common Misconceptions

stacy avatar
6 diapositives · 251 Views · Jul 27, 2014

Learn the truth about confidence intervals and their interpretation, debunking myths around probability and sample means. Gain clarity on capturing population mean with confidence intervals.
Understanding Confidence Intervals: Debunking Common Misconceptions - slide 1
01 / 6Understanding Confidence Intervals: Debunking Common Misconceptions
1 / 17

Télécharger la présentation

Understanding Confidence Intervals: Debunking Common Misconceptions
Une image / un lien ci-dessous est fourni (tel quel) pour télécharger la présentation

Politique de téléchargement : le contenu du site vous est fourni TEL QUEL pour votre information et votre usage personnel ; il ne peut être vendu, concédé sous licence ni partagé sur d’autres sites sans l’accord de son auteur.Le contenu vous est fourni TEL QUEL, pour votre information et votre usage personnel uniquement. Téléchargez la présentation en cliquant sur ce lien. Lors du téléchargement, si vous ne parvenez pas à télécharger une présentation, l’éditeur a peut-être supprimé le fichier de son serveur.Pendant le téléchargement, si vous ne parvenez pas à obtenir une présentation, le fichier a peut-être été supprimé par l’éditeur.

F I N

Plus de contenu associé

Transcription de la présentation
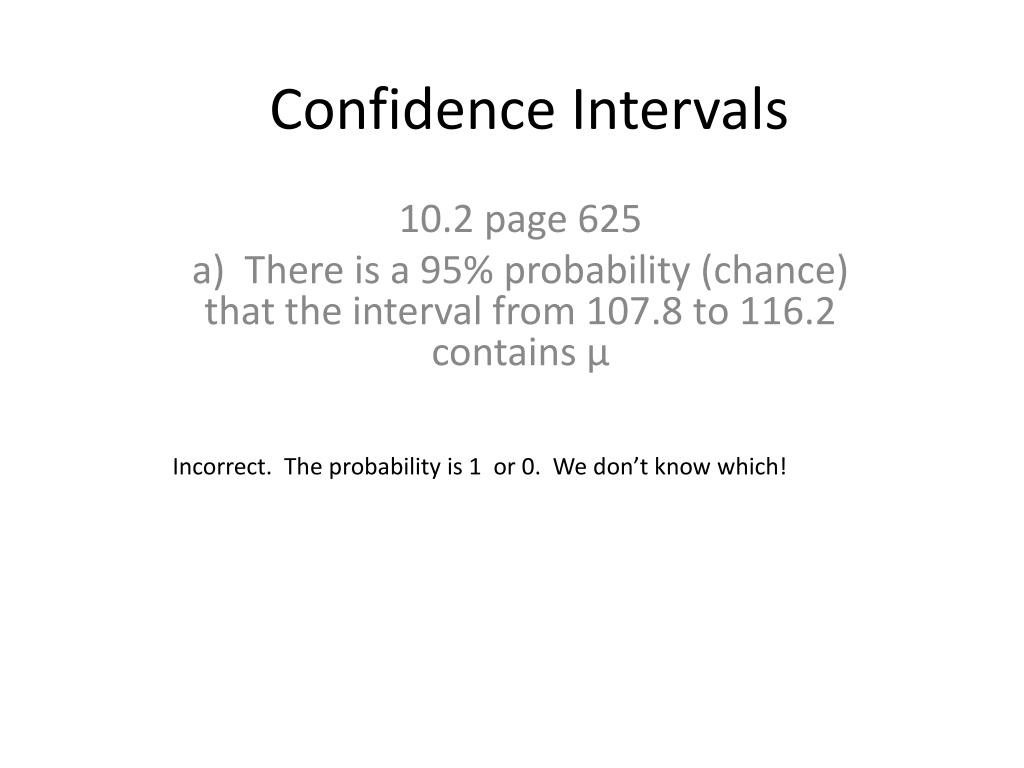
  1. Confidence Intervals 10.2 page 625 a) There is a 95% probability (chance) that the interval from 107.8 to 116.2 contains µ Incorrect. The probability is 1 or 0. We don’t know which!

  2. 10.2 page 625b) There is a 95% chance that the interval (107.8 ,116.2) contains x bar. • Incorrect. The general form of these confidence intervals is xbar + or – m (margin of error), so xbar is always in the center of the interval!

  3. 10.2 page 625c) This interval was constructed using a method that results in intervals which capture the true mean in 95% of all possible samples. • Incorrect. The different samples will yield different sample means, and the distribution of those sample means is used to provide an interval that captures the population mean.

  4. 10.2 page 625d) 95% of all possible samples will contain the interval (107.8, 116.2) • Incorrect. There is nothing magical about the interval from this one sample! Our method of computing confidence intervals is based on capturing the mean of the population, not a particular interval from one sample.

  5. e)The probability of the interval (107.8, 116.2) captures µ is either 0 or 1, but we don’t know which! • YEAH! CORRECT INTERPRETATION!