Download
1 / 32
340 likes | 585 Vues
Learn about biomes, climatograms, and how to interpret climate data with detailed explanations and examples. Understand the characteristics of different ecosystems and climates around the world.

E N D
Climographs • The temperatures shown are monthly averages • First the daily averages are figured: add the high and the low and divide by 2. If the high was 80 and the low was 50, the average is 65 degrees Fahrenheit • Then add all the daily averages and divide by the number of days in that month (28, 29, 30, or 31) • Then the averages for January for 100 or more years are added and averaged. That’s what goes on the graph. • So when all 12 months are arranged in a line graph, you see the general pattern of temperatures for the year. • What you don’t see are the extremes For example a climograph for St. Louis won’t show that the lowest ever was -23 degrees Fahrenheit and the higest was 115.
Climographs • The precipitation pattern is shown by the bar graph • For each month, they average the amount of precipitation received for 100 or more years (as long as they have been keeping records) • What you get is a general pattern of yearly precipitation – do all months get about the same amount? Are there wet months and dry months. • You also get the average yearly total amount of precipitation. • What you don’t get was the driest for that month and what year was the wettest. What was the lowest yearly total and what was the highest yearly total.
These graphs are quite useful to get an idea of the general patterns of a particular place.But you do not get the extremes. Some climographs give two line graphs. One for the average monthly highs and the other for the average monthly lows. This gives a little more realistic picture; however, it doesn’t show the extremes either.
You will notice that there is a great variety among them. A rather typical climograph is given for each of the biome types
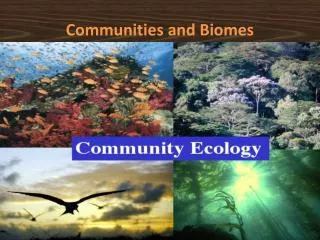
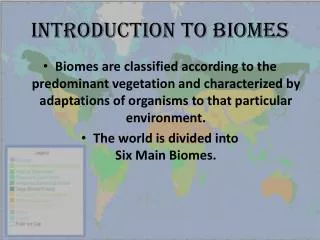
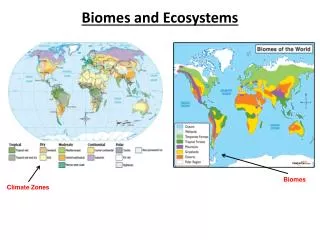
What is a biome? • A biome is a large group of similar ecosystems that share the same type of climate and communities(plant and animal varieties).
What is a biome? • Terrestrial Biomes • On land • Aquatic biomes • Marine • Oceans • Fresh water • Most Lakes • Streams • Ponds • Rivers
Terrestrial Biomes • Latitude • degrees north and south of the equator • sun strikes Earth differently • As a result, climates (abiotic factors) are different • Altitude also affects climate North pole Sun’s rays 66.5o 23.5o o O Sun’s rays 0 Equator 23.5o Sun’s rays 66.5o South pole
Terrestrial Biomes Annual precipitation (cm) 400 Tropical rain forest 300 Temperate rain forest 200 Temperate forest 100 Woodland Savanna Taiga Grassland Shrubland Tundra Desert -10 0 10 20 30 Average temperature (oC)
What is a climatogram? • A graph that shows a rough approximation of the annual climate pattern of a region • Average Monthly Precipitation • Average Monthly Temperature
a. Tundra a. b. Taiga nothing c. Temperate forest Temperate forest d. Grassland Temperate forest e. Desert Temperate forest Tropical Rainforest f. Temperate forest Temperate forest Temperate forest Temperate forest
Section 3.2 Summary – pages 70-83 Life on the tundra • No trees • Long summer days • Short periods of winter sunlight
Section 3.2 Summary – pages 70-83 Life on the tundra • Due to its latitude, temperatures never rise above freezing for long • Only the topmost layer of soil thaws during the summer • Underneath this top layer is a layer of permanently frozen ground called permafrost • The soil is lacking in nutrients
Section 3.2 Summary – pages 70-83 Life on the taiga • Just south of the tundra lies another biome that circles the north pole • The taiga (TI guh) also is called the boreal or northern coniferous forest
Section 3.2 Summary – pages 70-83 Life on the taiga • Warmer and wetter than tundra • Short, mild summers • Long, harsh winters
Section 3.2 Summary – pages 70-83 Life on the taiga • Topsoil is acidic • Organic material decays slowly • Few minerals
Section 3.2 Summary – pages 70-83 Life in the desert • The driest biome is the desert biome. A desert is an arid region with sparse to almost nonexistent plant life.
Life in the desert Section 3.2 Summary – pages 70-83 • Deserts usually get less than 25 cm of precipitation annually.
Life in the desert Section 3.2 Summary – pages 70-83 • With rainfall as the major limiting factor, vegetation in deserts varies greatly. • The driest deserts are drifting sand dunes.
Section 3.2 Summary – pages 70-83 Life in the desert • Many desert plants are annuals that germinate from seed and grow to maturity quickly after sporadic rainfall. • The leaves of some desert plants curl up, or even drop off altogether, thus reducing water loss during extremely dry spells. • Many desert mammals are small herbivores that remain under cover during the heat of the day, emerging at night to forage on plants.
Section 3.2 Summary – pages 70-83 Life in the grassland • Grasslands are large communities covered with rich soil, grasses, and similar plants.
Section 3.2 Summary – pages 70-83 Life in the grassland • Grasslands, occur principally in climates that experience a dry season, where insufficient water exists to support forests. • Grasslands contain few trees per hectare. • The soil is usually rich in humus for a considerable depth.
Section 3.2 Summary – pages 70-83 Life in the temperate forest • When precipitation ranges from about 70 to 150 cm annually in the temperate zone, temperate deciduous forests develop.
Section 3.2 Summary – pages 70-83 Life in the temperate forest • Temperate or deciduous forests are dominated by broad-leaved hardwood trees that lose their foliage annually. • The soil of temperate forests usually consists of a top layer that is rich in humus and a deeper layer of clay.
Life in rain forests Section 3.2 Summary – pages 70-83 • The average temperature is about 250C.
Last name: “A” through “F” Last name: “G” through “Mc” Last name: “Me” through “Sc” Last name: “Se” through “Z”