Download
1 / 25
250 likes | 364 Vues
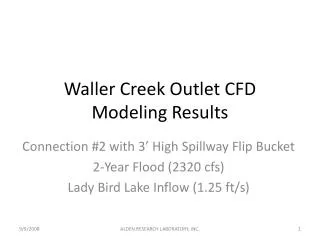
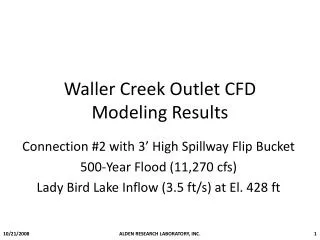
This preliminary report presents the modeling and simulation results of a two-year flow scenario for the Waller Creek Intake using Computational Fluid Dynamics (CFD) techniques. The analysis includes detailed plots of velocity contours and isosurfaces at various elevations and locations around the flood control turning vane and morning glory spillway. This study aims to evaluate the flow dynamics, enhance understanding of hydraulic behaviors, and inform future design and operational strategies for flood control. Results are displayed at 250 seconds across multiple slice planes.

E N D
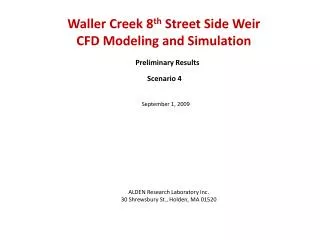
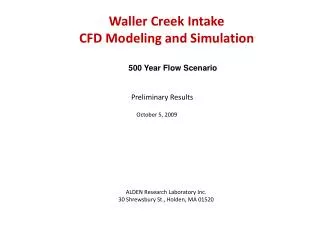
Waller Creek IntakeCFD Modeling and Simulation 2 Year Flow Scenario Preliminary Results October 14, 2009 ALDEN Research Laboratory Inc. 30 Shrewsbury St., Holden, MA 01520
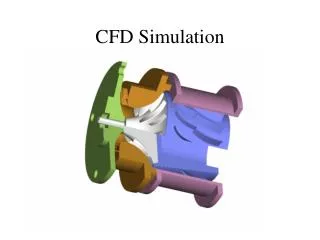
CFD model geometry with proposed flood control turning vane Flood control turning vane 1 2 3 4 5 6
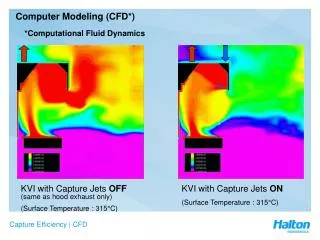
Plot of velocity contours with vectors (Slice plane cut horizontally at elevation 465 Ft.) Time = 250 sec.
Plot of velocity contours with vectors (Slice plane cut horizontally at elevation 470 Ft.) Time = 250 sec.
Plot of velocity contours with vectors (Slice plane cut horizontally at elevation 476 Ft.) Time = 250 sec.
Plot of velocity contours with vectors (Slice plane cut vertically at the center of the morning glory spillway.) slice plane cut locations Time = 250 sec.
Plot of velocity contours with vectors (Slice plane cut vertically at the center of the morning glory spillway.) slice plane cut locations Time = 250 sec.
Plot of velocity contours (Slice planes cut vertically at the center of the morning glory spillway at different locations.) Isometric view 1 Time = 250 sec.
Plot of velocity contours (Slice planes cut vertically at the center of the morning glory spillway at different locations.) Isometric view 2 Time = 250 sec.
Velocity contour through each bar screen Isometric view 1 Time = 250 sec. 2 6 3 5 4
Velocity contour through each bar screen Isometric view 2 Time = 250 sec. 1 6 2 5 3 4
Velocity contour through each bar screen Isometric view 3 Time = 250 sec. 6 5 4 3 1 2
Isosurface plot of water colored with velocity magnitude (Isometric view) Time = 250 sec.
Isosurface plot of water colored with velocity magnitude (Isometric view) Time = 250 sec. * same with slide 13 but different color scale
Isosurface plot of water colored with velocity magnitude (Plan view) Time = 250 sec.
Isosurface plot of water colored with velocity magnitude (Plan view) Time = 250 sec. * same with slide 15 but different color scale
Isosurface plot of water colored with water surface elevation (Isometric view) Time = 250 sec.
Isosurface plot of water colored with water surface elevation (Plan view) Time = 250 sec.