Chapter 5: Probability
Chapter 5: Probability. 5.1 Probability Rules 5.2 The Addition Rule and Complements 5.3 Independence and the Multiplication Rule 5.4 Conditional Probability and the General Multiplication Rule 5.5 Counting Techniques. November 4, 2008. 1. Example.


Chapter 5: Probability
E N D
Presentation Transcript
Chapter 5: Probability 5.1 Probability Rules 5.2 The Addition Rule and Complements 5.3 Independence and the Multiplication Rule 5.4 Conditional Probability and the General Multiplication Rule 5.5 Counting Techniques November 4, 2008 1
Example Question: When you submit your 2007 IRS tax return in 2008, what are your chances of having it audited by the IRS if your income is less than $25,000? That is, what is the probability of being audited? That is, what is the chance that you will be audited by the government. Information: In 1997, 1.5% were audited. 2007 Tax Auditing
How can Probability Quantify Randomness? Question: What does the word probability mean? Possible Answer:Probability is a branch of mathematics that deals with calculating the likelihood of a given event's occurrence, which is expressed as a number between 1 and 0. An event with a probability of 1 can be considered a certainty: for example, the probability of a coin toss resulting in either "heads" or "tails" is 1, because there are no other options, assuming the coin lands flat. An event with a probability of .5 can be considered to have equal odds of occurring or not occurring: for example, the probability of a coin toss resulting in "heads" is .5, because the toss is equally as likely to result in "tails." An event with a probability of 0 can be considered an impossibility: for example, the probability that the coin will land (flat) without either side facing up is 0, because either "heads" or "tails" must be facing up. A little paradoxical, probability theory applies precise calculations to quantify uncertain measures of random events. http://whatis.techtarget.com/definition/0,,sid9_gci549076,00.html
Another Definition Probability is the branch of mathematics that studies the possible outcomes of given events together with the outcomes' relative likelihoods and distributions. In common usage, the word "probability" is used to mean the chance that a particular event (or set of events) will occur expressed on a linear scale from 0 (impossibility) to 1 (certainty), also expressed as a percentage between 0 and 100%. The analysis of events governed by probability is called statistics. http://mathworld.wolfram.com/Probability.html
Randomness • Randomness is often observed in the outcomes of a response variable in either an observational or experimental study. • All the possible outcomes are known, but it is uncertain which outcome will occur for any given observation. • Randomness is the opposite of deterministic where a given input doesn’t always produces the same result.
Creating Random Events • A machine or procedure that produces random events is called a randomizer. • Examples of Randomizers: • Rolling dice • Wheel of Fortune • Flipping a coin • Drawing a card from a shuffled deck
Terminology The process of rolling the die several times with varying results is called a probabilityexperiment. Each roll of the die or dice is called a trial or outcome or event. The number of times that a certain event (outcome) occurs divided by the total number so trials is called the cumulativeproportion or relativefrequency of the probability experiment. Suppose that in rolling one die 200 times, the number 2 occurs 45 times. The cumulative proportion of this event is 45/200 = 0.225.
Events and Sample Space Definition: A simpleevent is an outcome from a probability experiment that is observed on a single repetition of the experiment. The samplespace of a probability experiment is the set of all possible simple events from the probability experiment. An event is a collection of simple events; in other words, it is a subset of the sample space. An event that consists of more than one outcome is called a compoundevent.
Simple and Compound Events * H = heart, D = diamond, C = club, S = spade
Examples Note: The event, 2 males and 1 female, is not simple, because it can happen as mmf, mfm or fmm. We would call this a compound event.
Remark If the relative frequencies of events are known in a population, then the probability of these events are exactly the relative frequencies. For example, if we know that a bag contains 2 red balls, 3 green balls, 4 white balls and 1 blue ball, then the probability of randomly selecting a red ball from the bag is the relative frequency of red balls i.e., 2/10 = 1/5 or 0.2. If the relative frequency of an event in a population is unknown, then it can be approximated by simulating the event.
Probability Model Definition: A probabilitymodel is a table that lists all possible outcomes of a probability experiment and their probabilities. The form of this table is shown below.
Example (probability model) The following table contains the probabilities of choosing different color balls out of a bag. Could this be a probability model for the experiment?
Example (probability model) Suppose that we have a bag of jelly beans in six colors (green, orange, blue, red, yellow and brown). We have determined by performing a number of trials that the probability of picking a particular color is: Note: This last equation is the probability of picking a jelly bean that is of the colors green or orange or blue or … .
Example Probability Experiment: Gender of children when a couple has three children. Event: Exactly 2 boys among the three children. E = 2 boys in 3 births. Sample Space:S = {fff, ffm, fmf, fmm, mff, mfm, mmf, mmm}. n = 8. Event for 2 boys: {fmm, mfm, mmf}. m = 3. Probability:P(E) = m/n = 3/8 = 0.375.
Two Types of Probability Classical Method: Using mathematics to compute the exact probability of an event. Empirical Method: Approximate the probability of an event by using a probability experiment and using the relative frequency of the event to estimate the exact probability
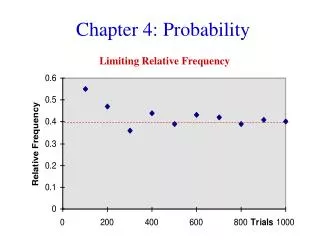
Example (Empirical) Find the long term number for heads in the probability experiment of flipping a coin. S = {h,t}. N = 10. Trial = {t, h, t, h, h, t, t, t, h, t}. fh = 4/10 = 0.4 N = 50. Trial = {h, h, h, h, t, t, h, t, h, t, h, t, t, h, t, t, t, t, h, h, t, t, h, t, t, h, h, h, t, t, h, h, h, h, t, t, t, t, h, t, t, h, h, h, t, h, h, h, t, t}. fh = 25/50 = 0.5 N = 100. Trial = {h, h, h, t, h, t, t, t, h, t, t, h, h, h, h, h, t, t, t, t, h, t, t, t, t, t, h, h, t, t, h, h, t, h, h, t, h, t, t, h, t, h, h, h, t, h, t, h, t, h, t, h, t, h, h, t, t, h, t, t, h, h, t, h, h, t, t, t, t, h, t, h, t, t, t, t, t, h, h, t, t, t, h, h, t, h, h, t, t, t, h, h, t, h, h, h, t, t, h, h}. fh= 48/100 = 0.48 As N >> 1, fh approaches 1/2.
Caution Over the “short run”, we do not expect the proportion of a particular event to the same as the proportion in the “long run.” For example, if I flip a coin 6 times, then I do not necessary expect that “heads” will occur exactly 3 times.
Examples (classical) Find the probability of select a heart out from a deck of cards each of which have equal chance of being selected. E = {heart} P(E) = 13/52 = 1/4 Find the probability of selecting a red card from a deck of cards each of which have equal chance of being selected. E = {red card} P(E) = 26/52 = 1/2 Find the probability of selecting a face card from a deck of cards each of which have equal chance of being selected. E = {face card} P(E) = 12/52 = 3/13
Example (classical) The West Meade Golf Shop sells used golf balls. This past Saturday I went to the shop and was told that the bag of used golf balls coned 35 Titlists, 25 Maxflis, and 20 Top-Flites. I was told that I could reach into the bag and select a ball. What is the probability that I would select a Titleist? Solution: Let E = {Titleist}. P(E) = 35/(35+25+20) = 35/80 = 0.4375.
Example (classical) Suppose a probability model has the following sample space: S = {1,2,3,4,5,6,7,8,9,10} i.e., there are ten possible outcomes in the probability experiment. (a) Compute the probability of the event of selecting three numbers with the outcome of {3,4,7} (b) Compute the probability of the event of selecting one number with the outcome of it being an even integer. Answers: (a) P(E) = 3/10; (b) P(E) = 1/2.
Example Example: Three question quiz. Problem: Find the possible outcomes for the student taking this three question quiz. Sample Space: {CCC,CCI,CIC,CII,ICC,ICI,IIC,III} Question: Chances of getting all three questions correct? Note that is a simple event. Answer: 1/8 = 0.125
Question: What are the chances of getting one out of the three questions correct? Answer: If A = {CII,ICI,IIC}, then P(A) = 3/8 = 0.375. Note that A is a compound event.
Probability Estimates from Survey Data 200 Vanderbilt students were surveyed about their main recreational habits: {listening to music, watch television, playing cards, exercising, other}. The following table summarizes the frequencies and relative frequencies in the survey. The probability that a Vanderbilt student watches TV for his or her main recreation is approximately 0.25.
Tree Diagram • An nice way of visualizing a sample space with a small number of outcomes. • As the number of possible outcomes for each trial increases, the tree diagram becomes impractical.
Example Background: An experimental study by the University of Wisconsin to determine if Echinacea is an effective treatment for the common cold. • MedicalExperiment • Multi-center randomized experiment • Half of the volunteers are randomly chosen to receive the herbal remedy and the other half will receive the placebo • Clinic in Madison, Wisconsin has four volunteers • Two men: Jamal and Ken • Two women: Linda and Mary • Probability Experiment • Randomly pairing the four volunteers • Sample Space to receive the herbal remedy: {(Jamal, Ken), (Jamal, Linda), (Jamal, Mary), (Ken, Linda), (Ken, Mary), (Linda, Mary)}
Assumption: The six possible outcomes in this sample space for receiving the Echinacea are equally likely. Hence, the probability that any simple event in the sample space will occur is 1/6. Hence, if S ={(Jamal, Ken), (Jamal, Linda), (Jamal, Mary), (Ken, Linda), (Ken, Mary), (Linda, Mary)}, then the probability of picking Ken and Linda is 1/6. The probability of picking one man and one women in a simple event is the probability of picking (Jamal, Linda) or (Jamal, Mary) or (Ken, Linda) or (Ken, Mary) i.e., 4(1/6) = 2/3. The probability of picking a simple event containing only women is (Linda, Mary) which has the probability 1/6.
Example Problem: Suppose we roll two dice (#1 & #2) once. What is the probability that the sum of the numbers on the dice is 7? Sample Space: Let (x,y) denote the ordered pair where x is the number form die #1 and y is the number from die #2. Then S = {(1,1),(1,2),(1,3),(1,4),(1,5),(1,6),(2,1),(2,2),(2,3),(2,4),(2,5),(2,6), (3,1),(3,2),(3,3),(3,4),(3,5),(3,6),(4,1),(4,2),(4,3),(4,4),(4,5),(4,6), (5,1),(5,2),(5,3),(5,4),(5,5),(5,6),(6,1),(6,2),(6,3),(6,4),(6,5),(6,6)} and N = 36. Event:E = {(1,6),(2,5),(3,4),(4,3),(5,2),(6,1)} Probability:P(E) = 6/36 = 1/6.
Problem: What is the probability of rolling “box cars?” Event:E = (6,6) (simple event) Probability:P(E) = 1/36
Example Problem: What are the chances of a taxpayer being audited by the IRS in 2003? Solution: The problem can be solved with a contingency table for the audits according to income level. We can compute the relative frequencies of being audited for each income level.
Sample Space: We define the sample space to be ordered pairs (x,y) where x is the income range and y is yes (audited) or no (not audited). For x we introduce some notation: < $25K x = 1 $25K-$49.999K x = 2 $50K-$99.999K x = 3 $100K < x = 4. S = {(1,yes),(1,no),(2,yes),(2,no),(3,yes),(3,no),(4,yes),(4,no)}
Probability of being audited (any income): 310/80200 = 0.004 or 0.4% • Probability of being audited and making an income over $100K: 80/10700 = 0.007 or 0.7% • Probability of being audited and making an income less than $25K: 90/14100 = 0.006 or 0.6%. • Probability of not being audited and making an income less than $25K: 14010/14100 = 0.994 or 99.6%. Remark: In this example we did not use the sample space, but rather a contingency table of incomes and audits.
Subjective Probability The probability of an event that is obtained on the basis of personal judgment is called subjectiveprobability. This type of calculation is the opposite of objective probability (for example, empirical probability calculations). Example: What was the probability of landing a man on the moon in the 1960’s? Any estimate of this probability would be subjective since we have no prior history of the event.
The Addition Rule and Complements Definition: Two events in a probability experiment are said to be disjoint if they have no common outcomes. Another term for the same concept is mutuallyexclusive i.e., both events cannot happen simultaneously. Suppose that A and B are events. If they are disjoint, then the probability and A and B happening is zero i.e., P(A and B) = 0. Section 5.2
Venn Diagrams There is a graphical way of looking at the intersection and union of sets. They are called VennDiagrams. http://kt2.exp.sis.pitt.edu:8080/venn/andor.jsp
Sets and Events Suppose that A is a set of events (possibly a single event in the sample space) and B is another set of events (again, possibly a single event) in a common sample space. We consider A and B to be subsets of the sample space. We can perform the set operations intersection and union. For example, the union of A and B is set of events that arise in A or B. The intersection of A and B is the set of events that is common to both events. Similarly, we can talk about the complement of Aci.e., the set of events that are not in A, but are in the sample space.
Union/Intersection of Events • The unionoftwoeventsA and B is the new event consisting of events that are either in AorB. • The intersectionoftwoeventsA and B is the new event consisting of events that are in AandB.
Sets, Events and Probabilities Suppose that we want to calculate the probability that a particular event in the same space will occur. For example in our three question pop quiz illustration, what is the probability that a student will have two and only two correct answers to the three questions. As we already know, the sample space can be viewed as a set and events are subsets of the sample space. That is, we have the event: A = {CCI,CIC,ICC}. Notice that the event B = {CII,ICI,IIC} is a disjoint event from the event A. In fact, A is disjoint from its complement: Ac = {CCC,CII,CIC,IIC,III}. The event, C, of getting one or two correct answers on the quiz is given by the set C which is the union of A and B i.e., C = {CII,ICI,IIC,CCI,CIC,ICC}. We would like to determine the probability of the event C by using information about the probabilities of events A and B.