Download
1 / 18
180 likes | 351 Vues
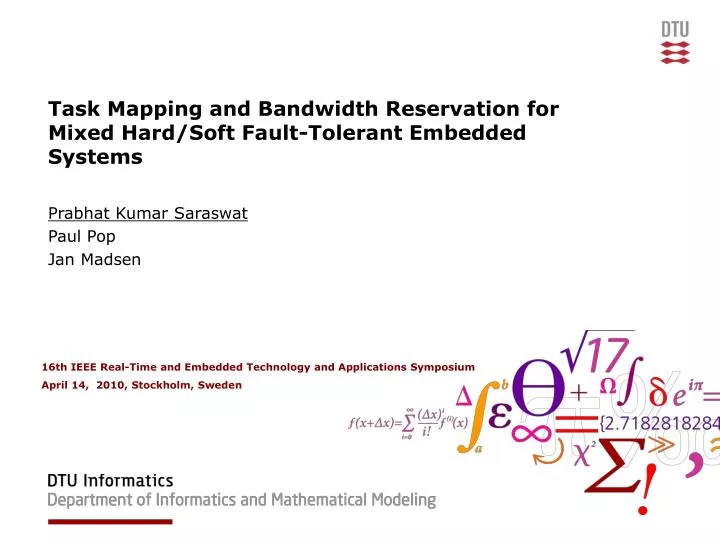
Task Mapping and Bandwidth Reservation for Mixed Hard/Soft Fault-Tolerant Embedded Systems. Prabhat Kumar Saraswat Paul Pop Jan Madsen. 16th IEEE Real-Time and Embedded Technology and Applications Symposium April 14, 2010, Stockholm, Sweden. Introduction.

E N D
Task Mapping and Bandwidth Reservation forMixed Hard/Soft Fault-Tolerant Embedded Systems Prabhat Kumar Saraswat Paul Pop Jan Madsen 16th IEEE Real-Time and Embedded Technology and Applications Symposium April 14, 2010, Stockholm, Sweden
Introduction Trend: Integration of different applications on the same platform Critical (e.g., ABS) Deadline miss – catastrophe Based on worst-case assumptions Best effort (e.g., multimedia) Deadline miss – performance degradation Variability in execution times Worst-case leads to overdesign Bridging the gap: partitioned architectures Fault tolerance
Mapping? ? ? Problem Description Utilization? • Given: A mixed hard/soft fault-tolerant application and a distributed platform • Determine: Mapping and Utilization • Such that: • Deadlines for all hard real-time tasks are satisfied (Even in case of faults) • Probability of meeting of deadline for soft tasks is maximized ? ? ? ? ? k transient faults Soft Task Hard Task Application Platform
Deadline Period WCET Hard real-time tasks Soft real-time tasks PDF Deadline Probability Execution Time Period Periodic Application Model • Set of tasks • Mixed task set – Hard and Soft tasks • All tasks are periodic • Tasks can tolerate transient or no faults
Constant Bandwidth Server • Temporal partitioning of hard/soft tasks. • Each soft task is assigned a CBS with parameters: • Qi – maximum server budget (bandwidth) • Ti – server period (period of the soft task) • A soft task is allowed to execute for only Qi units of time every period Ti • Hard tasks and CBS servers execute under EDF • Probability of meeting the deadline (QoS) depends on Qi Soft Hard Processor Util.
2+7+7+7 2+7+7 2+7 3 1 2 CBS Example [Abeni 98] Hard WCET=2 Period=3 Soft task CBS Bandwidth = 2 Period = 7 18 20 22 2 10 4 12 6 14 8 16
A Execution Segment τ1 With checkpointing and fault recovery τ11 τ12 τ12 Checkpointing Overhead Error Detection Overhead Recovery Overhead Platform Model Fault model • Equidistant checkpointing with rollback recovery • Execution of task is divided into segments • After each segment checkpoints (state of a task) are stored in a stable storage • In case of fault, the state is restored from the stored checkpoint Without checkpointing
Schedulability analysis • Utilization based test is used to check if the task set mapped on a processor is schedulable • Sum of utilizations of the following: • Hard tasks • Considering checkpointing overheads • Soft tasks • CBS parameters – Server budget and the period • Recovery Utilization • Utilization needed to recover the hard tasks incase of faults considering worst case scenario
Stochastic Analysis • CBS server is modeled as a queue • A request of Ck units arrives every Ti units of time. • At most Qi units can be served every Ti units • The probability that a job Jk finishes before its deadline is related to Vk • Vk (the length of queue at kTi) isa Markov Chain describing the system • A stationary solution for the state probability vector of Vk is calculated • QoS is calculated from this stationary solution Qi Probability Vk = max{0,Vk-1 – Qi} + cj Execution time
Over design! Implementation not possible 1 (0.60) 2 (0.80) QoS 74.50 QoS 94.74 1 (0.38) 1 (0.23) 2 (0.37) 2 (0.22) WCET (99.98%, 37) (99.98%, 22) PDFs (89.50%, 38) AET (49.02%, 23) PDFs Bandwidth Allocation using PDFs 0.6 Util. = 1 0.4 • Naive approach: • Allocate Q proportional to their AETs • For 1 • Util = 11/(11+17) x 0.6 • For 2 • Util = 17/(11+17) x 0.6 Initial AET Spare Utilization Utilization for Hard tasks period = 100 (60) (80) (11) (17) (40) Using PDFs better design decisions can be taken
Mapping Example N1 N2 1 6 5 3 19 55 9 55 P5 P5 10 65 23 45 4 2 24 55 15 55 i Q Period QoS: 72.10 % i Optimal solution using AETs WCET Period N1 N2 2 1 6 5 17 55 6 55 P5 P5 4 3 10 65 23 45 26 55 17 55 QoS: 94.22 % Optimal solution using PDFs
Tabu Search Mapping and Bandwidth Allocation (TSMBA) • Iterative exploration of design space • Use of Tabu List to avoid revisiting of already explored solutions • TSMBA • Takes as input, the application and the architecture model • An initial solution, can be unschedulable • Produces a solution containing • Mapping for all tasks • Set of bandwidth values for all soft tasks • Solutions are evaluated on the basis of this Cost function: • Minimize cost function = Schedulable solutions and Maximized QoS
Tabu Search - Moves Diversification move – mapping and bandwidth for all tasks are changed N1 N2 τ1 6 τ2 11 τ3 16 τ4 21 QoS: 63% τ3 τ1 τ4 τ6 τ2 τ5 mapping move bandwidth move N1 N2 N1 N2 τ1 6 τ2 11 τ3 16 τ4 21 QoS: 48% τ1 τ3 τ1 τ1 6 τ2 15 τ3 16 τ4 21 QoS: 71% τ1 τ3 τ4 τ6 τ2 τ5 τ4 τ6 τ2 τ5
Experimental Setup • Proposed optimizing strategy (TSMBA) vs straightforward (SF) strategy • SF strategy • Used when only AETs are available, not PDFs • Maximizing the difference between allocated Q value and AET for all soft tasks • Cost Function avg / dev • Generated synthetic benchmarks: • PDFs to match the shape of real-life benchmarks • Messages (bus utilization should not be greater than 1, non preemptive EDF) • Assume that all half of the hard tasks are safety critical Allocated Q AET WCET avg
Experimental results Synthetic benchmarks • QoS resulted by TSMBA is better than SF on an average of 29.60% • TSMBA finds schedulable solutions much earlier than SF approach
Experimental results Real-life benchmarks • QoS resulted by TSMBA is better than SF on an average of 28.04%
Conclusions • A Tabu Search based heuristic is proposed to perform design optimizations • Results in implementation where deadlines of hard tasks are satisfied (even in case of faults) and QoS for soft tasks is maximized • Better design choices can be made by taking stochastic execution times of soft tasks into consideration.