Download
1 / 28
280 likes | 306 Vues
Delve into the impact of Hurricane Andrew 20 years on, exploring lessons, changes in insurance, disaster management, and building codes. Discover the evolution in catastrophic risk management and the importance of strong building codes in creating disaster-resistant communities.

E N D
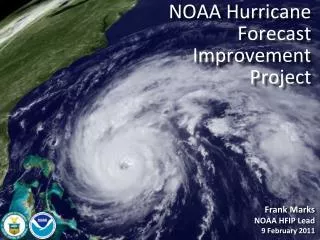
The Legacy of Hurricane Andrew:What Has Been Learned Over the Past 20 Years? Florida International University Miami, FL June 27, 2012 Download at www.iii.org/presentations Robert P. Hartwig, Ph.D., CPCU, President & Economist Insurance Information Institute 110 William Street New York, NY 10038 Tel: 212.346.5520 Cell: 917.453.1885 bobh@iii.org www.iii.org
Hurricane Andrew: The Legacy Lives On • At $15.5 Bill, Hurricane Andrew Was the Costliest Insurance Event in Global History When it Occurred in 1992 ($25 Bill in 2011 $) • Andrew held that title until the Sept. 11, 2001 terrorist attacks ($24 bill in 2011 $) • Most expensive natural disaster until Hurricane Katrina ($47.6 bill in 2011 $) • Hurricane Andrew Was the Most Disruptive Event in US Insurance History • 11 small insurers failed (FL, LA); resources of many large insurers were strained • Hurricane Andrew Fundamentally and Irrevocably Changed How Insurers and Reinsurers Manage Catastrophic Risk in the US and Globally • Insurance Markets Changes Occurring in the 20 Years Since Andrew: • More Carefully Managed Coastal Exposure (and for cat exposure in general) • Capital Base (Capacity) of Global (Re)Insurance Industry Greatly Expanded • More Use of Reinsurance • Birth and Rapid Evolution of Sophisticated Catastrophe Modeling • Growth of Markets Like Bermuda • Use of Capital Market Instruments (e.g., CAT Bonds) • Larger Role of Government in Insuring Coastal Risks • Strong Support for Strengthened Building Codes and Mitigation
Lesson Learned: Strong Building Codes, Mitigation Are Essential in Creating Disaster Resistant Communities Hurricane Andrew Had Major Impact on Building Code Strengthening and Enforcement 3
Residential Building Code Ratings in Hurricane Prone States Florida and Virginia were the top ranked states in terms preparedness of residential structures against hurricane damage Despite catastrophic losses from Hurricane Katrina in 2005, MS still has no statewide building code, putting it dead last in the US; AL and TX rank poorly as well despite major post-Andrew storms Source: Rating the States, Dec. 31, 2011, Insurance Institute for Business and Home Safety; Insurance Information Institute.
Florida Leads the US with 2.1 Million NFIP Policies in Force* *As of Sept. 30, 2011 Source: National Flood Insurance Program; Insurance Information Institute. eSlide – P6466 – The Financial Crisis and the Future of the P/C
Insurance Industry Invests Millions in Property Loss Reduction Research In 2010, the Insurance Institute for Business and Home Safety Research Center Opened in Chester County, SC. The $40 Million Facility Is Entirely Funded by the Insurance Industry and Its Mission Is to Conduct Research to Reduce Property Loss from a Variety of Perils, Including Hurricanes Source: Insurance Information Institute from IBHS web site: http://ofb.ibhs.org/research eSlide – P6466 – The Financial Crisis and the Future of the P/C
Lesson NOT Learned: The US Is More Vulnerable than Ever to Catastrophic Hurricane Loss Hurricane Andrew Had Zero Effect in Terms of Diminishing Demand for At-Risk Property 7
U.S. Insured Catastrophe Loss Update 2011 Was One of the Most Expensive Years on Record 8
Top 14 Most Costly Disastersin U.S. History (Insured Losses, 2011 Dollars, $ Billions) Even 20 years later, Hurricane Andrew is the 2nd most expensive event in US history Most of the costliest disaster in US history were hurricanes, most impacting FL *Losses will actually be broken down into several “events” as determined by PCS. Includes losses for the period April 1 – June 30. Sources: PCS; Insurance Information Institute inflation adjustments.
Natural Disasters in the United States, 1980 – 2011Number of Events (Annual Totals 1980 – 2011) There were 117 natural disaster events in 2011 Number 37 8 51 2 Meteorological (storm) Climatological (temperature extremes, drought, wildfire) Geophysical (earthquake, tsunami, volcanic activity) Hydrological (flood, mass movement) Source: MR NatCatSERVICE 10
US Insured Catastrophe Losses $100 Billion CAT Year is Coming Eventually ($ Billions, 2011 Dollars) Record Tornado Losses Caused 2011 CAT Losses to Surge US CAT Losses in 2011 Were the 5th Highest in US History on An Inflation Adjusted Basis *PCS figure as of April 6, 2012. Note: 2001 figure includes $20.3B for 9/11 losses reported through 12/31/01 ($25.9B 2011 dollars). Includes only business and personal property claims, business interruption and auto claims. Non-prop/BI losses = $12.2B ($15.6B in 2011 dollars.) Sources: Property Claims Service/ISO; Insurance Information Institute. 12 12/01/09 - 9pm eSlide – P6466 – The Financial Crisis and the Future of the P/C
Inflation Adjusted U.S. Catastrophe Losses by Cause of Loss, 1990–2011:H11 Wind/Hail/Flood (3), $12.7 Fires (4), $9.0 Other (5), $0.6 Geological Events, $18.5 Terrorism, $24.9 Winter Storms, $30.0 Hurricanes & Tropical Storms, $160.5 Tornado share of CAT losses is rising Wind losses are by far cause the most catastrophe losses, even if hurricanes/TS are excluded. Tornadoes (2), $119.5 Catastrophes are defined as events causing direct insured losses to property of $25 million or more in 2009 dollars. Excludes snow. Does not include NFIP flood losses Includes wildland fires Includes civil disorders, water damage, utility disruptions and non-property losses such as those covered by workers compensation. Source: ISO’s Property Claim Services Unit.
Florida’s Longest Span Between Hurricanes The current hurricane dry spell is the second longest in recorded history. Despite recent low activity, it is not a question of “IF” a hurricane will hit Florida but “WHEN” 6 Years 249 Days* 6 Years 317 Days* 6 Years 79 Days* 9 Years 53 Days *As of June 30, 2012 Source: USA Today, 6/26/12. from flhurricane.com; Insurance Information Institute.
RNW Homeowners: FL vs. U.S.,1990-2010 (Percent) Sources: NAIC. 15
Homeowners Average Expenditure: FL vs. U.S., 1995-2009 Sources: NAIC. 16
Global Property Catastrophe Rate on Line Index, 1990—2012 (as of Jan. 1) Hurricane Andrew had a major impact on Property-Cat reinsurance pricing Sources: Guy Carpenter; Insurance Information Institute.
2011 Property and Casualty InsuranceRegulatory Report Card D+ AK AL A+ WA ME C- B+ MT ND VT B C D NH MN B D+ MA OR ID B NY WI B- CT SD = A = B = C = D = F = NG B- RI B MI B+ A NJ WY C- PA B- A A+ D IA C+ B MD OH NE B+ DE NV IL IN WV B A+ B- C+ UT VA B+ CO C C MO KY A C KS B B C CA NC C TN D C OK SC C C- AR AZ NM B Source: James Madison Institute, February 2008. C C- B+ HI AL GA MS C C+ B- LA TX Florida was the only state to get a grade of “F” in 2011, due in large part to it’s disastrous state-run (re)insurance programs C- FL D F Not Graded: District of Columbia Source: R Street Institute, June 2012.
Coastal Residual Market Exposure State-Run Coastal Plans Surged With Population Growth in Exposed States; Growth Continues 19
Population Growth Projections for Hurricane Exposed States (2000 to 2030) (000s) By 2030, Florida is expecting a population increase of 12.7 million, closely followed by Texas with an expected increase of 12.5 million. The U.S. as a whole is expected to have a population increase of 82.1 million, or 29.2 percent during the same period. Source: U.S. Census Bureau, accessed at http://www.census.gov/population/projections/PressTab1.xls
U.S. Residual Market: Total Policies In-Force (1990-2011) (000) (000) Katrina, Rita and Wilma 4 Florida Hurricanes Hurricane Andrew In the 22-year period between 1990 and 2011, the total number of policies in-force in the residual market (FAIR & Beach/Windstorm) Plans has more than tripled. Source: PIPSO; Insurance Information Institute
U.S. Residual Market Exposure to Loss($ Billions) ($ Billions) Katrina, Rita and Wilma 4 Florida Hurricanes Hurricane Andrew In the 22-year period between 1990 and 2011, total exposure to loss in the residual market (FAIR & Beach/Windstorm) Plans has surged from $54.7 billion in 1990 to a record high of $884.7 billion in 2011. Source: PIPSO; Insurance Information Institute (I.I.I.). 23
Total Value of Insured Coastal Exposure In 2007($ Billions) Florida had $2.5 trillion in insured coastal property exposure in 2007, the highest of any hurricane-exposed state. Source: AIR Worldwide
Insured Coastal Exposure As a % Of Statewide Insured Exposure In 2007 Source: AIR Worldwide
Florida Citizens Exposure to Loss ($ Billions) Since its creation in 2002, total exposure to loss in Florida Citizens has increased by 230 percent, from $154.6 billion to $510.7 billion in 2011. Source: PIPSO; Insurance Information Institute (I.I.I.).
Mississippi Windstorm Plan: Exposure to Loss (Millions of Dollars) Total exposure to loss in the Mississippi Windstorm Underwriting Association (MWUA) has surged by 1,943 percent, from $352.9 million in 1990 to $7.2 billion in 2011. Source: PIPSO; Insurance Information Institute
Texas Windstorm Insurance Association (TWIA): Exposure to Loss (Building & Contents Only) ($ Billions) TWIA’s exposure to loss for building & contents has surged by 495 percent in the last 12 years from $12.1 billion in 2000 to $72.0 billion in 2012. Source: TWIA at 06/05/12, Texas Department of Insurance, Southwestern Insurance Information Services (SIIS)
Massachusetts FAIR Plan Exposure to Loss (Billions of Dollars) In the 22-year period between 1990 and 2011, total exposure to loss in the MA FAIR plan has surged by 1,771 percent from $4.1 billion in 1990 to $76.7 billion in 2011. Source: PIPSO; Insurance Information Institute
Insurance Information Institute Online: www.iii.org Thank you for your timeand your attention! Twitter: twitter.com/bob_hartwig Download at www.iii.org/presentations