Download
1 / 33
330 likes | 357 Vues
Enhance your skills in estimating wind speeds and assessing storm damage using the Fujita Scale. Learn to differentiate between tornado and straight-line wind damage and report effectively to the National Weather Service. This comprehensive training covers the Enhanced Fujita wind damage scale, problems in estimating wind speeds, and quantifying variables for accurate assessments. Gain valuable insights into interpreting tree damage to estimate maximum wind speeds and identify storm types. Stay informed on the latest developments in severe weather verification and reporting guidelines. Join this educational program to enhance your storm damage survey capabilities today!

E N D
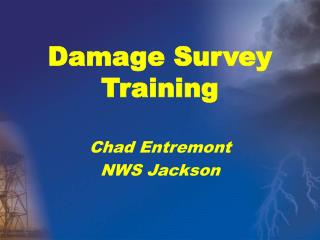
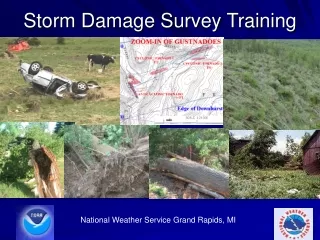
Storm Damage Survey Training National Weather Service Grand Rapids, MI
The Increased Verification of Severe Thunderstorms Program INVEST: The need to match up radar data with ground truth • Real-time or post-storm info from the public is crucial to NWS operations. • DURING the storm, we use this information to get a better feel for what radar thresholds will create severe weather at the surface. • AFTER the storm, we use this information for warning verification and to decide what storms are worth doing damage surveys for.
Goals of this Training • Become familiar with the Fujita damage scale and learn how to estimate maximum wind speeds from tree damage • Be able to differentiate between tornado and straight-line wind damage • Know what to report to the National Weather Service and how to report it
Estimating Wind Speeds and Storm Types From Tree Damage Interpolate, Estimate, and Attempt to Standardize
Part I : Wind Speeds Tree Damage May Be All You Have From a Storm • The Enhanced Fujita wind damage scale • Problems in estimating wind speeds from damage • Quantifying the Variables • Developing a Standardized Reference Base • Note that some of this may be subjective
The Fujita Damage Scale Maximum Wind Speeds Estimated from Damage The original scale was developed around 1970 by Dr. Ted Fujita who assigned wind speeds to expected damage produced by strong winds observed in tornadoes. On February 1, 2007, the original Fujita Scale, in use by the National Weather Service since the 1970s, was replaced by the Enhanced Fujita Scale. The new scale used advances in science from wind engineering studies to adjust the wind speeds of the original scale.
Enhanced F Scale for Tornado Damage An update to the the original F-scale by a team of meteorologists and wind engineers, to be implemented in the U.S. on 1 February 2007. *** IMPORTANT NOTE ABOUT ENHANCED F-SCALE WINDS:The Enhanced F-scale still is a set of wind estimates (not measurements) based on damage. Its uses three-second gusts estimated at the point of damage based on a judgment of 8 levels of damage to the 28 indicators listed below. These estimates vary with height and exposure. Important: The 3 second gust is not the same wind as in standard surface observations. Standard measurements are taken by weather stations in open exposures, using a directly measured, "one minute mile" speed. Enhanced F Scale Damage Indicators F to EF Comparison Wind speeds in the operational scale were rounded to avoid implying more accuracy than is justified. These winds are at the standard height of 10 meters. A 95 page PDF file explaining the development and makeup of the Enhanced F-scale now is available, both here at SPC and from the Texas Tech server. Back to The Online Tornado FAQ <P. Enhanced F-scale Website SPC Home Page
Severe Winds Defined • Winds of 58 mph (50 knots) and greater are considered “severe”, and this is the wind threshold for a severe thunderstorm warning. • So the boundary between non-severe and severe winds is in the 55 to 60 mph range • The boundary between EF0 and EF1 winds is in the 85 to 90 mph range.
Some of the Problems to be Overcome The Reference Dilemma 1. No standardized, detailed reference relating tree damage to wind speed. 2. Difficult to estimate the effect of so many variables. 3. It takes time to do a thorough survey (you may not be able to cover a large area in one day).
Important Variables for Trees: “Structural Integrity”: Insects, disease, lightning, fire, and type of tree. Root system: shallow or deep? Exposure: Exposed or protected from the direction of the wind? Ground: For uprooting: Soil Type. Wet or dry? Tree Species: Deciduous/Non-deciduous. If deciduous, leafed out? Height/age, crown size. Root system. How brittle?
Some Examples: The isolated snapped trunk or limb. Ask: Why didn’t surrounding trees fall? Some possible reasons could include: lightning strike, dead or rotten tree, or that the tree was more exposed to the wind than surrounding tree.
The isolated big tree down: Ask: Was it lightning? Lack of structural integrity? Look for rotten wood. How much good wood was there? Again, why did the other trees survive?
What do you notice here? 1.) Large tree 2.) Exposed to wind 3.) Foliated 4.) Other tree downed 5.) No damage to home 6.) Wood not rotten, but brittle?
What about here? 1.)Trees exposed to the wind fell, others didn’t 2.) Uprooted, not snapped. Roots fairly deep. 3.) Wet Soil?
And Here? 1.)Trees both snapped and uprooted. 2.) Root ball appears wide and shallow
Here? 1.) Discolored wood = rotten. Hollow?
Lightning: 1.) Look for splintered wood 2.) Evidence of fire. 3.) Very isolated damage 4.) Ask eyewitnesses
The Clean Up: Look for where breakage occurred.
Telephone Poles: Either trees falling on wires or force of wind against wires in open country can cause poles to snap. Very difficult to estimate wind speeds needed to do the latter.
Rules of Thumb • To estimate wind speeds from tree damage, only consider healthy trees with the diameter of the downed trunk or limb being 6 inches or greater • Non-severe winds (less than 58 mph) will generally not take down many healthy trees or tree limbs of this size • Wind speeds of EF1 (86 to 110 mph) or greater will often take down groups of healthy, large trees
The “Swath Concept” Use to differentiate between EF0 and EF1 wind speeds • A stand of at least 10 healthy trees, greater than 6 inches in diameter • More than half of them downed • Implies EF1 damage • Lesser damage assigned EF0
Swaths may be large or very small. Be careful: note that some big trees may take others down as they fall.
What about stronger damage? 100% blowdown = EF2? Standardize: We should try to match up measured wind speeds and estimates from structural damage and apply those values to observed tree damage.
Part II: What was it? Differentiating downburst from gustnado • Match up damage in space and time with radar data (gather eyewitness data on storm time) • Make detailed plot of tree and debris fall • Ask eyewitnesses: did rain/hail precede or accompany the storm? Most downbursts will occur at the time of heavy rain/hail.
Tornado Damage: Damage is convergent: trees fall generally pointing inward towards the center of the damage path. Microburst/Downburst (aka “straight-line winds”): Damage is divergent: trees fall generally pointing away from the center of the damage path.
This is an example of a convergent tree fall pattern as seen from the ground. A tornado moved from left to right across the field of view. The two trees in the foreground fell first as the leading edge of the tornado’s winds hit them and the trees in the background were then downed by the back side of the tornado. Look for signs of this crossing or “herringbone” pattern in the downed trees to indicate tornado wind damage.
Some tornadoes have more than one funnel, rotating about a common center. These funnels are called suction vortexes and create a more chaotic, but still convergent, pattern of fallen trees. This tornado moved from top to bottom of the field of view.
The fan-shaped, divergent tree fall pattern that is typical of a microburst, as seen from the air: Complicating factor: tornado damage may be close to or within downburst damage.
Draw a detailed map of “damage vectors”. Include every downed tree, blown debris. Be careful of “outliers”: trees may have been moved after the storm or forced to fall in a different direction.
Tornadoes can knock trees down in one prevailing direction. The faster a vortex is moving, the more the debris pattern will appear to be unidirectional.This is because the force of the wind in the direction of the storm movement becomes greater than the force of the wind in other directions. For example, a tornado with 100 mph winds moving to the east at 50 mph will produce 150 mph winds on its south side and only 50 mph winds on its north side. A simple schematic illustrates what happens to the magnitude of the wind as a vortex begins moving towards the right: Stationary Fast Slow
Finally, a subjective observation: Tornadoes seem more likely to do odd things such as impaling debris into walls or the ground, carrying debris for long distances and suspending debris aloft on power lines and trees.
Reporting Procedures • Digital photos of damage or survey maps can be emailed to the office. Contact the office at 1-800-647-3836 or use e-spotter to ask for email address to send photos to • The most useful photo of tree damage is a close-up of the break point, but also include a wide-field photo to show perspective
Send comments to: ERNEST.OSTUNO@NOAA.GOV Download available at: http://www.crh.noaa.gov/grr/education/