Download
1 / 19
210 likes | 410 Vues
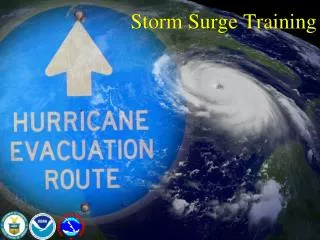
Storm Surge Training. SLOSH Storm Surge Model. Behind the scenes. Pre-generated Parallel runs of Similar intensity storms Worst Case Scenario Maps Real-time SLOSH Probabilistic storm surge (online for public) Real-Time SLOSH runs (NWS Only). Winds 120 mph Eye Diameter 25nm

E N D
SLOSH Storm Surge Model Behind the scenes • Pre-generated • Parallel runs of Similar intensity storms • Worst Case Scenario Maps • Real-time SLOSH • Probabilistic storm surge (online for public) • Real-Time SLOSH runs (NWS Only)
Winds 120 mph Eye Diameter 25nm Moving NW 5 mph
Winds 120 mph Eye Diameter 25nm Moving WNW 15 mph
Realtime SLOSH Limitations • STRONGLY dependent on accurate track forecast! • Very inaccurate more than a day in advance of landfall • Use with extreme caution!
NHC TRACK ERROR 12 hr. OUT 133 mph, 933 mb. Hurricane Advisory – Approximately 12 hr. before landfall
Rmax=25 mi (forecast) Surge Based on NHC -12 hr. Advisory
ACTUAL TRACK TRACK FORECAST 133 mph, 933 mb. Actual Hurricane Track 30 mi. E of -12 hr. Advisory Forecast Track
Rmax=40 mi Surge Based on NHC Storm Best Track
Probabilistic Storm Surge • Uses an ensemble of SLOSH runs • Intended to be used operationally so it is based on NHC’s official advisory • Based on statistics of past performance of the advisories • Based on size, intensity, of current and past storms rather than a random sampling
Other Parameters Size: Small (30%), Medium (40%), Large (30%) Forward Speed: Fast (30%), Medium (40%), Slow (30%) Intensity: Strong (30%), Medium (40%), Weak (30%)
When is it Available? • Initiated whenever a hurricane watch is issued! • Available ~20-30 minutes after advisory release
Available Surge Products Probabilistic: This graphic shows the overall chance that storm surges will be greater than x feet above normal tide levels during the next 3 days. Exceedance: This experimental graphic shows storm surge heights, in feet above normal tide level, which have a x percent chance of being exceeded during the next 3 days.
Deterministic SLOSH run shows limited surge threat to Pensacola area Rmax=25 mi (forecast) Surge Based on NHC -12 hr. Advisory
Probabilistic product shows considerable surge threat to Pensacola area