Property Tax Rates Analysis: Residential, Agricultural, Commercial, and Total Trends 2002-2012
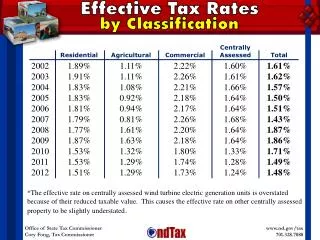
Explore the fluctuation in effective property tax rates for residential, agricultural, commercial properties, and total assessed values from 2002 to 2012. The data reveals varying rates over the years, with insights into specific classifications' tax burdens.

Property Tax Rates Analysis: Residential, Agricultural, Commercial, and Total Trends 2002-2012
E N D
Presentation Transcript
Effective Tax Rates by Classification Centrally Residential Agricultural Commercial Assessed Total 2002 1.89% 1.11% 2.22% 1.60% 1.61% 2003 1.91% 1.11% 2.26% 1.61% 1.62% 2004 1.83% 1.08% 2.21% 1.66% 1.57% 2005 1.83% 0.92% 2.18% 1.64% 1.50% 2006 1.81% 0.94% 2.17% 1.64% 1.51% 2007 1.79% 0.81% 2.26% 1.68% 1.43% 2008 1.77% 1.61% 2.20% 1.64% 1.87% 2009 1.87% 1.63% 2.18% 1.64% 1.86% 2010 1.53% 1.32% 1.80% 1.33% 1.71% 2011 1.53% 1.29% 1.74% 1.28% 1.49% 2012 1.51% 1.29% 1.73% 1.24% 1.48% *The effective rate on centrally assessed wind turbine electric generation units is overstated because of their reduced taxable value. This causes the effective rate on other centrally assessed property to be slightly understated.