Download
1 / 65
660 likes | 852 Vues
Bio fuels and food security An FAO Perspective Seminar at Imperial Queens Park Hotel, Bangkok, 15 June 2011 on ”food Crop Crisis: on the stream of alternative energy”. Hiroyuki Konuma FAO Assistant Director-General and Regional Representative for Asia and the Pacific.

E N D
Bio fuels and food security An FAO Perspective Seminar at Imperial Queens Park Hotel, Bangkok, 15 June 2011 on ”food Crop Crisis: on thestream of alternative energy” Hiroyuki Konuma FAO Assistant Director-General and Regional Representative for Asia and the Pacific
Review of world and regional food security and hunger situation New challenge : rising food prices and its impact Medium and long-term food security challenges Alternative energy, bio energy and bio fuel Bio energy and food security Bio fuels and food security in Thailand FAO’s initiatives and actions Recommendations towards sustainable bio fuel and food security Outline of presentation
Regional trends in the number of undernourished, from 1990-2 to 2010 Source: FAO SOFI 2010
Asia and the Pacific is the home of 62 percent of world hungry population
success in economic growth did not result in alleviating hunger Inequitable distribution of benefit of economic growth widening disparity and inequality at both in least developed countries and middle income countries
Food price crisis 2007-08 (food price index rose to highest 214 point in June 2008, combined with global economic crisis, pushed additional 150 million into chronic hunger; exceeded one billion in December 2009) Gradual decline of food prices (July 2008-June 2010) and chronic hunger (decreased to 925 million in Sept.2010) Re-emergence of rising food prices started in July 2010 New Challenge to Food Securityrising food price volatility
Natural disaster (drought in Russia and CIS countries in July 2010) Restriction of grain exports by Russia Increasing uncertainty led food commodity competitive markets increasingly sensitive to external shocks Bad weather in USA and Europe led to production decline Continuous natural disasters in Pakistan and Australia (floods), drought in China, etc. Increasing global demands (food, feed, bio-energy) Lower food stocks and tightening supply-demand balance Crude oil price increase, production cost hike Currency exchange rate
FAO Food Price Index 223 point in December 2010 exceeded peak in 2008 (213 point)
FAO Food Price Index reached record high 237 point in February:March 231: April 232
FAO Cereal Price Index in April up 5.5% from March, 71% higher than one year ago
International wheat price in April up by 9% from March, 82% higher than one year ago, but 24% lower than peak in March 2008
InternationalMaize price in April up by 11% from March, over 100% up from one year ago, renewing historical highest record
International export price of rice (Thai white rice 100%B) kept decreasing, in April 3% down from March, almost same level of one year ago, but 47% below the peak in May 2008
Poor households spend as much as 70% of their income for foods. Increase of chronic hunger Accordingly to World bank, food price hike since October 2010 pushed 44 million people into extreme poverty (15 February 2011) Increase in foreign debt of food importing countries-political instability Food riots (Mozambique in September 2010, more than 10 countries in 2008) Political unrest in Middle East, etc... Negative consequences of food price hike -poor suffers most
World population reaches 9.1billion by 2050 To feed these population, world has to increase food production by 70% (100% for developing countries) by 2050 If not, world security and social stability would be seriously threatened However, this has to be attained under various existing constraints, such as ....... Medium/Long-Term Food Security and Sustainable Development Challenges
Crude oil :Commodity Futures Price Quotes ForLight Crude Oil (Pit)Weekly Commodity Futures Price Chart
World bio-ethanol and bio-diesel production is projected to be doubled in 20 years between 2009 and 2018; increasing competition of land and water use with food production, in addition to competition of use of food grains between bio-ethanol and food/feed
Stagnation of expansion of arable land (projected only 70-80 million ha or 5% increase by 2050)
Impact of world natural disasters by region:1975-2008Source: ADRC Natural Disaster Data Book 2008
Stagnation of crop productivity growth Source: FAO SOFI 2009 Source: FAO SOFI 2009
Annual growth rate of agricultural research and development declined sharply to less than a half in 1991-2000 from 1976-81
- Combination of efforts including varietal improvement (70%), irrigation expansion (x2), chemical pesticides and fertilizer use (x35), farm mechanization(x25), etc. in 40 years. - Food price (adjusted inflation), declined by 40% which benefited consumers, especially the poor. - World undernourished population fallen from 35% in 1970 to 17% in 2000-2002. - Impact on soil erosion, loss of forests, water stress, etc. Decline in interest on agriculture and agricultural investment Lessons learned from Green Revolution
Green revolution in Asia Source: FAOSTAT, July 2002 and Dr. Borlaug’s estimated on modern variety adoption, based on CIMMYT and IRRI data
Green revolution increased cereal production by 300% in 40 years New target: 70% increase (100% in developing countries) in 40 years by 2050 FAO estimates that 90% (80% in developing countries alone) of the production increase are projected to come from increase in yields and cropping intensity), and only 10% (or 20% in developing countries) of the production increase would come from expansion of arable land. Green revolution once again
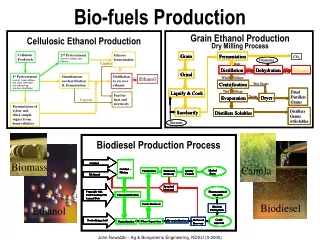
Primary Solid Biomass Biogas Liquid biofuels Municipal waste What is bio energy? Bio energy is.... .....all energy produced from bio fuels, which are fuels produced directly or indirectly from biomass. FAO definition
Outlook for bioenergy production by type, 2005 - 2030 Changes in composition Source: World Bank, 2010 ...expected in the future
ASEAN Primary Energy Demand by Fuel Type, Reference Scenario (MToE), 1980 - 2030 Energy is Asia Source: IEA, 2009 Action to advance renewable energy required
Potential benefits of bio energy Energy Security Diversify Agriculture Output Job creation & enterprise development Renewable feedstock Reduced emissions Are many
Projected annual consumption & production of bioenergy in Asia-Pacific (MToE), 2005-30 Regional bioenergy outlook Source: Author’s, based on World Bank & FAO 2010
Projected annual consumption & production of biofuels in Asia-Pacific (MToE), 2005-30 Regional bio energy outlook Source: Author’s, based on World Bank & FAO 2010 Use of biofuels will grow considerably
China • 362 GW RE (incl. biomass) by 2020 • 15 billion litres of biofuel by 2020 • Vietnam • 5% RE (incl. biomass) by 2020 • 560 million litres of biofuel by 2020 • Thailand • 20% RE (incl. biomass) by 2022 • 5 billion litres of biofuel by 2022 • India • 15% RE (incl. biomass) by 2020 • Ethanol mandates in certain states • Philippines • 267 MW biomass by 2030 • 10% ethanol by 2011 • Indonesia • 5% RE by 2025 • 5% biofuels by 2025 Biofuel development …will be driven by government policies
Thailand’s Policy ContextThailand Alternative Energy Development Plan (AEDP) 2008-2022
Key feedstock: Cassava Outlook Source: FAO, OAE 2010 Cassava
Cassava yields, selected countries: 1999 - 2009 Crop productivity-Cassava Source: FAOSTAT Future growth is possible