Leveraging Urban Data: Insights and Challenges for Spatial Analysis
40 likes | 145 Vues
Explore the wealth of urban data available online to extract valuable insights and facilitate visualizing large datasets. Dive into spatial analysis methods to address key questions on building distribution patterns and types.

Leveraging Urban Data: Insights and Challenges for Spatial Analysis
E N D
Presentation Transcript
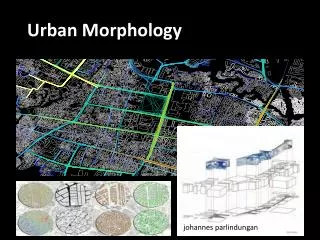
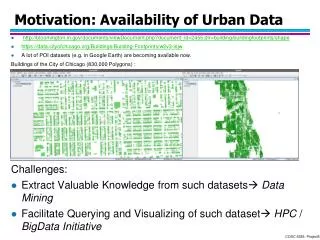
Motivation: Availability of Urban Data • http://bloomington.in.gov/documents/viewDocument.php?document_id=2455;dir=building/buildingfootprints/shape • https://data.cityofchicago.org/Buildings/Building-Footprints/w2v3-isjw • A lot of POI datasets (e.g. in Google Earth) are becoming available now. Buildings of the City of Chicago (830,000 Polygons) : Challenges: • Extract Valuable Knowledge from such datasets Data Mining • Facilitate Querying and Visualizing of such dataset HPC / BigData Initiative
Project5 Questions for Dataset Zinj • Are buildings randomly distributed or is there some clustering? • Are buildings of the same building type collocated, anti-collocated or not? • Are building belonging to different building types collocated, anti-collocated or not—for example, you will try to answer the question if garages are collocated with commercial buildings. • Idea to answer question: create curves based on number of objects within the radius of another object/kNN-distance,… and obtain answers by comparing curves generated for different contexts. See: http://wiki.landscapetoolbox.org/doku.php/spatial_analysis_methods:ripley_s_k_and_pair_correlation_function
Example: Collocation Red and Green Objects FOR radii r1,…,rn DO FOR all green objects g DO Compute #-of-red objects within radius rj of g ENDDO Compute average rojof values observed in previous loop Put entry (rj, (roj/total_number_of_red_objects)) into Curve ENDDO
An Alternative Approach Using k-Nearest-Neighbor Distance FOR k=k1,…,krDO FOR all green objects gp DO Compute distance rdp to k-nearest red object to g ENDDO Compute average rdiof values observed in previous loop Put entry (ki, rdi) into the Curve ENDDO Remark: For k-values use 0.1% of the red objects; 0.1*1.5 of the red objects, 0.1%*1.52 of the red objects, 0.1%*1.53 of the red objects,…, until at most 50% of the red objects—with x being the ceiling function computing the smallest integer that is greater equal than x. d6 d3 d1