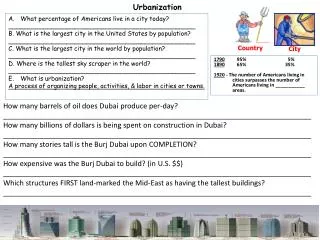
Urbanization (A)
Urbanization (A). Link to syllabus. Link to WDI. Link to MIT Architecture web page. MENA: Map, with major cities. Data. Fig. 10.2 p. 266 (R&W). Urban Population/Total, by Regions . See next slide. Urban Population as % of Total MENA Compared to Other Regions. Source: WDI and FAOSTAT.


Urbanization (A)
E N D
Presentation Transcript
Urbanization (A) Link to syllabus Link to WDI Link to MIT Architecture web page
Fig. 10.2 p. 266 (R&W). Urban Population/Total, by Regions See next slide
Urban Population as % of TotalMENA Compared to Other Regions Source: WDI and FAOSTAT
Fig. 10.3 p. 267 (R&W). Growth of Urban Population, by Regions 1970-2004 General Decline in growth rate, more rapidly in MENA & Latin America SubSAfrica MENA LA S.Asia E. Asia
Table 10.1 p. 265 (R&W). Urban Population, MENA Countries See next slide
Urban Population as % of Total Sources: WDI and FAOSTAT
MENA: Populations of Large Cities Sources: Mitchell International Historical Statistics, and Demographic Yearbook
Cairo, Population WDI data
Turkish Urbanization Source: Saqqaf, The Middle East City, 1987
Industrialization in Iran, 1925-1973 Source: Encyclopaedia Iranica
Economic analysis of migration: International or Rural/Urban Source: Pugel International Economics, Figure 15.4 page 341
W. Arthur Lewis (1915-1990) Nobel Prize Winner, 1979 “Economic Development with Unlimited Supplies of Labor,” 1954 Author and editor of many books. Born in St. Lucia, (Caribbean). Raised in Antigua.Parents were both teachers, and he received much education at home. His father died when he was 7; his mother raised their five children; “I have never known someone as focused and hardworking.”
Econ Development with Unlimited Supplies of Labor: Lewis Rural sector has unlimited supplies of labor at fixed-subsistence-wage. (Peasant) farmers have an average product = subsistence level, suggesting a certain type of economic irrationality on the farm. Growth of (urban) industry will draw in immigrants from countryside, until excess labor in the countryside is used up. Major conclusion for policy: encourage investment in urban industry. Implies that there is no loss from ignoring rural development. This model tended to ignore foreign trade, although Lewis certainly was aware of its importance.
Summary of Migration Theories • Standard theory (push-pull) : migration depends on (wurban – wrural – cost). Views migration as helpful – reducing excess rural population. Cost of migration is declining. Complications: who migrates? Brain drain. Remissions. Stage migration. Cultural changes for urban immigrants. Non-econ migration. City lights. • Harris-Todaro model: migration depends on probability of getting a job, ratio of employed/(employed + unemployed). Policy implication: if gov’t makes a job in city to absorb unemployed, more than one person will migrate to city. Similar result for urban benefits like transportation, education, health… Policy-remove urban bias implicit in these policies. • Informal sector-not unemployed, but underemployed! People live and work outside of formal (“paper trail”) sector, so their incomes, health, services, tax payments, etc. are lower. Low skill, low capital. Ease of entry and exit. Low upward mobility.
Migration (ii) – Informal Sector • Is the informal sector the result of market forces, or market failures? Gov’t constraints on markets? (Hernando de Soto: Other Path 1989). Lack of capital/labor substitutability? Part of normal growth of a firm? • urban bias: transportation and other infrastructure, health, education. Subsidies for food, jobs, credit. Move the capital • Policy issues are: remove informals, or legalize /remove constraints. • Informality in jobs and housing – (slums). People co-exist in both. • Informality in labor markets: Both genders. Self-employed –’manufacturing’ and services. Less educated. Younger. (mt: Makes unemployment data meaningless) • Informality in production; small, self-financing, • mt looks at Bazaar/suqs as previous type of informality which is being displaced by ‘modernization.’ A century ago many jobs were controlled by guilds- maybe that’s an earlier example of informality.
The Informal Sector in the Middle East: Labor and Employment Data
Informal Sector Employment / Total Non-Ag. p. 107 ~40%-60% There are some indications that this share is falling. Source: World Bank (2004) Unlocking the Employment Potential in the MENA page107
Topics in Middle Eastern and North African Economies, Vol. 12 2010
Changes in Informal Employment in Egypt: 1998-2006 Source: Wahba
Self-employment in the informal sector Major factor. Source: ILO: Women and men in the informal sector
Informal Employment In MENA, more men than women. Opposite in LAC and SSAfrica. Source: ILO Women and men in the informal sector
Who are the informal workers? Egypt Source: Wahba
Probability of Informal Employment in Egypt, by Gender Men more likely to work in the informal sector than women. ‘Informality’ increased in the 1990s. Source: World Bank (2004) Unlocking the Employment Potential in the MENA page109
Probability of Informal Employment in Egypt, by Educational Level p. 109 Source: World Bank (2004) Unlocking the Employment Potential in the MENA page109
Informal Employment, Egypt (I) WDI reports 1998 population as 64.8 million; population between 15 and 65 as 58.7%, or 38 million, and labor force as 18.4 million. Survey reports 1998 population at 60.5 million, and non-agricultural wage earning workers as 9.8 million (p. 127) Using criteria such as working on a contract, paying social security, or having a ‘regular job’ to define the formal sector, the Informal Sector/Non Ag wage workers was 33% - 46 % (p. 134) Source: World Bank (2004) Unlocking the Employment Potential in the MENA
Informal Employment Egypt (II) Source: World Bank (2004) Unlocking the Employment Potential in the MENA
Informal Employment Egypt (III) Source: World Bank (2004) Unlocking the Employment Potential in the MENA
Entrepreneurs of Small and Micro-Enterprises: Lebanon Source: Hamdan (2006) “Micro and Small Enterprises in Lebanon “
Sources of Initial Capital: Lebanon SMEs Source: Hamdan (2006) “Micro and Small Enterprises in Lebanon “
صناعة المشروبات الغازية في العراق العظيم يتم استلام المواد الاولية من افضل المناشئ العالمية – سوق مريدي
مرحلة التنظيف بواسطة (تكنلوجيا الاوزون ) والتي تمتلكها الدول المتقدمة فقط
نموذج لاحدث معمل بالشرق لاوسط وبأيدي مهرة تدربت بالدول الاوربية
مرحلة التعبئة (وتتم في غرفة معقمة وآلية ولاتلمس باليد) هذا النعال مستورد من شركة ببسي
النظافة عنواننا :احد عمالنا المتخصصين بالنظافة البايلوجية يطهر المعمل بعد انتهاء التعبئة
يتم فحص السيفونات يدويا لاختيار احسن سيفونة لمنتوجاتنا
مرحلة كبس السيفونة بأيدي مهرة وباحدث تقنية
فحص بلاشعة السينية والبنفسجية والفستوقية لخلو المنتج من الاجسام الغريبة مثل الصراصر والمرادين
Table 10.3 p. 271(R&W). MENA Slums (see next slide)
Distribution of World’s Slum Dwellers “Slum” is defined in terms of five indexes: clean water, improved sanitation, security of tenure, durability of dwellings, and sufficient living area. Source: UN: State of the World’s Cities 2004/2005
Urban Population: % in Slums, 1990 and 2001 Sub-Saharan Africa and South Asia have highest levels. Reductions in several countries/regions.
Slum Incidence and Infant Mortality: MENA “Slum” is defined in terms of five indexes Source: UN: State of the World’s Cities 2004/2005
Slum Incidence Related to HDI Slum Incidence andPer Capita GDP “Slum” is defined in terms of five indexes Source: UN: State of the World’s Cities 2004/2005
A roadside thieves’ market in Syria, selling furniture left in homes abandoned by refugees. Source: MERIP (winter 2013)