Post Survey Webinar
Join us for an enlightening webinar focusing on the TELL New Mexico Survey and its implications for education leaders. Discover best practices for utilizing data to improve teaching conditions and support educators. Hear from experts Ann Maddock and Dawn Shephard from the New Teacher Center, as they share insights on data analysis, response bias, and actionable strategies to drive school improvement. Engage in discussions and Q&A to ensure the findings inform policy decisions and enhance educational outcomes for students and teachers alike.

Post Survey Webinar
E N D
Presentation Transcript
Post Survey Webinar for Education Leaders • About this Web Meeting: • You may use your computer’s audio/speakers- please click on “Tools” and complete the “Audio Wizard’ to make sure your speakers are working • Or, you may use the phone bridge: 866 740 1260 access code 600 4945 • Please mute your phone unless you are speaking • You may type in the chat box on the lower left side at any time May 22 , 2014 Ann Maddock & Dawn Shephard New Teacher Center
If you are joining the Webinar by phone, please mute your phone at all times unless you are speaking. Phone access 866 740 1260 Access code 600 4945If you have any questions throughout the session, please write them in the Chat Board area on the left side of the screen. Both the Audio and Webinar will be recorded and a link provided so you may reference this presentation as needed.
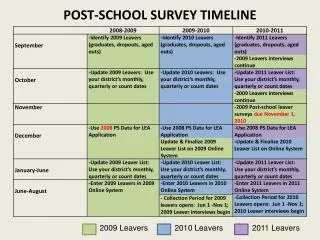
goals Share TELL NumbersProvide Suggestions for Data UseShare an Activity to “Unwrap Your Data”School, District Results Per Question Summary and Detailed Reports Downloading Reports Guides to Using your DataReview Next Steps
Lead sponsor of the survey: UNM Office of Provost; survey administered by NTC; Coordinated with Partners • TELL Core Questions externally validated; connected to student achievement & teacher retention; customized • The TELL Survey was administered January 27-March 10, 2014 • Anonymous, online, 24 hours/day • Letters were sent to school principals with access codes to randomly distribute to teachers • Teachers and Principals surveyed • Help Desk was available Recap
About the 2014 New Mexico Respondents 3,952 NM Educators • 3,529Teachers • 104 Principals • 46 Assistant Principals • 273 other education professionals (school counselors, school psychologists, social workers, etc.) 94 schools met or exceeded the 35 percent participation threshold.
Response Bias Due to low repose rate, NTC completed a Response Bias analysis of the results. Below is one Chart from the analysis. Table 3:TELL Respondents Compared to the State on Student Characteristics
Results for Statewide Numbers Publicly Available Response Rate # Responses # Educators State Detailed Results State Summary Results Principal Survey Results
Results for Schools & Districts Are Pass Code Protected
Suggestions for Data Use Teaching conditions matter for students and for educators. Understanding that not everyone sees them the same way is important in developing strategies and policies for school improvement. By making this data part of the school improvement planning process, findings from each teaching condition construct can be seamlessly integrated in the current and emerging school improvement programs at every school.
Don’t regard this as an attempt to merely document the physical structure and related resources in a school building • While physical facilities and resources are included in the research base, other complex factors influencing the professional teaching practices of educators are also measured Douse the findings to inform school and district level decisions about: • Scheduling • Professional development offerings • Opportunities to support and cultivate teacher leadership, collaboration, and • Investments in facilities and resources
Don’t over- or under-represent the data in local policy decision-making • Local policymakers should neither ignore the power of teaching conditions data, nor make policy without the context of other data points about the school and/or district Douse this data to help drive local-level policy decisions • Reviewing data results with local teacher associations, school leadership, local school boards, legislators, and other decision-makers can ensure that policies and resources are more responsive to the most pressing needs of students, educators, schools, and districts
Don’t use the information within the vacuum of a single school, with fear of comparisons to other schools • The results will prove more meaningful if used to support collaborative efforts to identify and implement best practices within and among schools Doview the results within the context of progress from year-to-year and relative to other groups of schools across a district and the state • The findings are reported with bars representing the school, district and state averages for questions and constructs .
Questions About What You Have Heard So Far? If you do not have any questions, and are ready to continue, please select the icon for polling and click on “no.” If you have any questions, please either raise your hand, or type into the chat box on the lower left of your screen.
In Order for Results to be Viewable*: • State Results - no minimum threshold, therefore reports are available. • District Results – Only districts which met the minimum threshold of 35% response rate and at least 20 respondents will have their data on the website (passcoded). • School Results – Only schools which met the minimum threshold of 35% response rate and at least 5 respondents will receive data (passcoded). * Even though an individual school may not have met threshold, ALL surveys submitted still count towards the district and state results; same for the district results.
# Responses # Educators Response Rate Locked Icons No Icons=No Results
PRINCIPAL’S STATE RESULTS ICON DETAILEDSTATE REPORT ICON SUMMARY STATE REPORT ICON
Unwrapping Your Data Begin by going to the website and enter your passcode. Enter your passcode View 2013 Results
DETAILED SCHOOL REPORT ICON SUMMARY SCHOOL REPORT ICON
How to View & Download School DETAILED Results download district like type school
How to View & Download School SUMMARY Results school District State download
Suggestions for School & District Leaders: Find Your Strengths and Weaknesses and Develop Talking Points (we will use examples of data from another state for the following slides) Once you have your passcode, visit the website, enter your passcode and view your Detailed results by scrolling through the screen results. Click on the Summary results icon and download a copy to print. Print enough copies for each person in the leadership team.
Using two different pens (in this example we use red and green) and in each construct (Time, Facilities & Resources, etc.) identify the two areas where your district is highest above the state rate of agreement and circle it in green. OR, if you have no areas above the state, find your two highest areas.
Do the same for the two areas where your school/district is below the state rate of agreement and circle it in red. OR, if you have no areas below, find your two lowest areas.
As a team, review each construct and discuss the red and green items. • The green items provide you a listing of the positive findings in each construct that you can highlight as “items our educators have indicated as being the most positive.” • The red items provide you a listing of the concerns most prevalent in your school or district, as compared to the state results.
Develop talking points that recognize the issues brought forth. • So, a suggested talking point regarding these findings might be: • “Our TELL results show us that the majority of our educators agree that teachers are protected from duties that interfere with their essential role of educating students. The results also show us that we need to work on issues such as minimizing interruptions to instruction and reducing class sizes. • We have reviewed our TELL results to determine areas in need, and look forward to working as a community as we develop our improvement plans.” • Or, keep it brief and simpler: • We noticed that our TELL results in the area of ‘time’ are not a strength for our school. However, in other areas such as professional development and school leadership, our district results are very encouraging. • We plan to look at our TELL results, along with other data, and make this information part of our planning for the future.”
Share your talking points with the faculty (or leadership team for districts) and how your team has done a ‘first glance’ at the TELL results. • Establish future dates and times where your school will delve deeper into the TELL findings to continue this review of the findings. There are numerous Guides on the www.telloregon.org website to guide you through each area and each question.
School and District Guides are Available on the “Tools” Tab School Guide for Using TELL Data District Guide for Using TELL Data Data Use Guide
Next Steps • View your results using the passcode sent to you. • Use the activity we just shared and find your strengths and weaknesses in each area of the survey. • With leadership team members, develop talking points. Share your common talking points with staff. • Plan collaborative conversations and utilize the data for school improvement planning: • Utilize upcoming professional days at the end of the school year, over summer, and before the next school year to discuss with your faculty leadership teams. • Access the training guides and resources available online to help guide conversations. • Keep us informed of your progress!