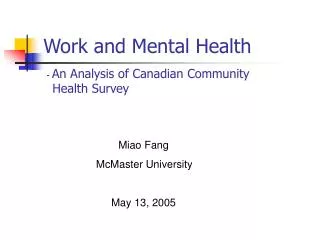
Work and Mental Health
290 likes | 431 Vues
This analysis investigates the relationship between work stressors and mental health in Canada, revealing that over 30% of Canadians experience significant work-related stress, contributing to a substantial burden of mental disorders and substance dependence. Using data from the Canadian Community Health Survey, we explore how work-related factors influence mental health care utilization among various demographics. The findings indicate that specific sub-groups—such as younger workers and non-married individuals—are at a higher risk of mental health issues but often do not seek necessary care.

Work and Mental Health
E N D
Presentation Transcript
- An Analysis of Canadian Community Health Survey Work and Mental Health Miao Fang McMaster University May 13, 2005
Outline • Introduction • Data, Sampling and Variables • Analyses • Results • Discussion and Conclusion
Background • Over 30% of Canadians reported that most days at work were quite a bit or extremely stressful. • 12% of Canadians aged from 15 to 64 suffer from a mental disorder or substance dependence. • The estimated cost of poor mental health in workplace is inbillionsof dollars. • Work Poor mental health disability and loss of productivity in workplace
Objective • Describe the relationship between work and mental health. • Describe the relationship between work and mental health care use for people with mental disorders and substance dependences. • Further explore covariates and interactions of any relationships.
Data • Canadian Community Health Survey • CCHS1.1 Response rate: 84.7% Sample size: 131,535 (Ontario workers:23,110) • CCHS1.2 Response rate: 77.0% Sample size: 36,984(Ontario workers: 8,008)
Sampling • Complex survey – multistage stratified cluster design • All estimates were weighed to represent the target Ontario workers population
Variables • Dependent variables - Mental disorders and substance dependences (MDSD) CCHS1.1 – Depression (0,1) CCHS1.2 – Any mental disorder or substance dependence (AMDSD) (0,1) Mental disordersSubstance dependences Major depressive episode Alcohol dependence Manic episode Illicit drug dependence Panic disorder Social phobia Agoraphobia
Variables - Mental health care utilization CCHS1.1 – Consultation with a m.h professional (0,1) CCHS1.2 – Utilization of any resource (for mental health) (0,1) • Main predictors (exposures) Work stressors (0-48) • Covariates Age, sex, BMI, race, marital status, education, income, type of smokers (all are categorical variables).
Analyses • Descriptive Analysis • Bivariate analysis • Logistic regression analysis
Descriptive Analysis Two-sample t test
Contingency Table Analysis • Pearson Chi-Squared test for independence
Measuring Association • The coefficient of contingency • Goodman and Kruskal’s Gamma - test for trend P - concordant pairs Q – discordant pairs
Variance Estimation • Maximum likelihood estimation
Variance Estimation • Bootstrap method BOOTVARE_V21.SPS 1) Calculate the point estimate using the final weight. 2) Calculate B estimates using the B bootstrap weights. 3) Calculate the variance of the B estimates.
Assessing the Fit of the Model- Hosmer-Lemeshow goodness of fit test To calculate the test statistic • Order the fitted values • Group the fitted values into g classes of roughly equal size • Calculate the observed and expected number in each group • Perform a goodness of fit test
10 10 8 8 Percent 6 6 4 4 Percent 2 2 0 0 12 15 18 21 24 27 30 33 36 39 3 3 6 6 9 9 12 15 18 21 24 27 30 33 36 39 42 Mean=19.1 (sd=5.2) Mean=19.4 (sd=5.0) Work Stressors (0 – 48) CCHS1.1 CCHS1.2
Work Stressors by MDSD CCHS1.1 CCHS1.2
Other variables by MDSD All values are significant at 0.05 level except those in parentheses.
An Example Model for AMDSD (Continued) Goodness-of-fit: Hosmer and Lemeshow x2=3.79 on 8 d.f., P=0.88
Summary of Findings • MDSD • Work stressors highly predicted MDSD • Sub-groups at higher risk of MDSD: non-white, women, younger workers, smokers, higher BMI, not married
Summary of Findings (Cont.) • Mental health care use • CCHS1.1 -More likely to consult with a mental health professional: older worker, women, whites, education at least to high school graduation • CCHS1.2 - More likely to use any resource: older worker, women, non-whites, lower work stressors
Conclusion • Work stressors were confirmed as predictive of MDSD. • Identified sub-groups that do not use the health care service for their mental health problems.