Download
1 / 1
10 likes | 276 Vues
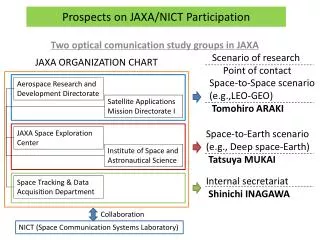
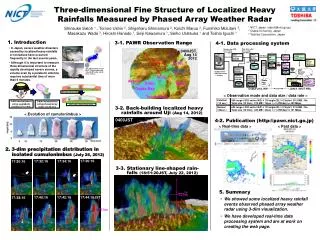
Data after radar processing ( 220 Mbps ). IQ data after DBF processing ( ~1 Gbps ). Three-dimensional Fine Structure of Localized Heavy Rainfalls Measured by Phased Array Weather Radar. Data accumulation section. Data conversion section (GPGPU). Osaka Univ. JGN-X Access Point

E N D
Data after radar processing (220 Mbps) IQ data after DBF processing(~1 Gbps) Three-dimensional Fine Structure of Localized Heavy Rainfalls Measured by Phased Array Weather Radar Data accumulation section Data conversion section (GPGPU) Osaka Univ. JGN-X Access Point (L2 Switch) Handai AP Server (220 Mbps) L3 Switch Data release server (Koganei) HUB (GbE) (220 Mbps) ssh RAID(63TB) Data Translate Server NAS(14.5TB) Antenna Equipment Monitoring control section NICTScience Cloud RAID(42TB) ssh IQ data before DBF processing(~6 Gbps) Offline processingsection Offline collection section Osaka Univ.LAN Petabyte storage (Keihanna) Data analysis server (Koganei) DAS(12TB) RAID JGN-X (NICT NW) Osaka Univ. NW Private NW 1 NICT, Japan (satoh@nict.go.jp) 2 Osaka University, Japan 3 Toshiba Corporation, Japan Shinsuke Satoh 1 , Tomoo Ushio 2, Shigeharu Shimamura 2, Koichi Maruo 2, Fumihiko Mizutani 3, Masakazu Wada 3, Hiroshi Hanado 1, Seiji Kawamura 1, Seiho Uratsuka 1 and Toshio Iguchi 1 1. Introduction 3-1. PAWR Observation Range 4-1. Data processing system ・ In Japan, severe weather disasters caused by localized heavy rainfalls or tornadoes have occurred frequently in the last several years. ・ Although it is important to measure three dimensional structure of the rapidly developed severe storms, a volume scan by a parabolic antenna requires substantial time of more than 5 minutes. 0400JST, Aug 14 2012 Flash flood in the Toga river, Kobe (28 July 2008) 60 km (radius) The observation area of MLIT C-band radar and X-band MP radar (small blue circles). Kyoto Uji F2 tornado in Tsukuba (6 may 2012) Suita Akashi Kobe Invisibleregion Nara Invisible region Big radar observation Osaka Bay < Observation mode and data size / data rate > 3-dim measurement using a parabolic antenna (5-10 min) 3-dim measurement using phased array radar (10-30 sec) Kansai Airport Small radar network observation 3-2. Back-building localized heavy rainfalls around Uji (Aug 14, 2012) < Evolution of cumulonimbus > 0400JST 4-2. Publication (http://pawr.nict.go.jp) < Real-time data > < Past data > 2. 3-dim precipitation distribution in isolated cumulonimbus (July 26, 2012) 17:36:16 17:34:16 17:32:16 17:30:16 3-3. Stationary line-shaped rain- falls (18:51:20JST, July 22, 2012) 5. Summary 12 km 17:44:16JST 17:42:16 17:40:16 17:38:16 • We showed some localized heavy rainfall events observed phased array weather radar using 3-dim visualization. • We have developed real-time data processing system and are at work on creating the web page. 10 km 40 km 5 km