Download
1 / 26
260 likes | 619 Vues
Presentations, Project Status Reporting, and Design Reviews CS4911 Spring 2007 Administration Grades – WebCT Announcements/Questions – Swiki Agenda Mid-Term Presentations (see webpage) Presentation Guidelines What is in a status report? Sample Contents Process Comments

E N D
Presentations, Project Status Reporting, and Design Reviews CS4911 Spring 2007
Administration • Grades – WebCT • Announcements/Questions – Swiki
Agenda • Mid-Term Presentations (see webpage) • Presentation Guidelines • What is in a status report? • Sample Contents • Process Comments • Final Presentations • Design Reviews • Test Plan
Guidelines • Each team has 15 minutes for midterm, 25-30 minutes for final presentations • Principle purpose of midterm is status, design review, Iter 1 demo and project description • Principle purpose of final is project (Iter 3) demo, results, and conclusions • Each team member must present at least once • Attendance at presentations mandatory, miss yours 1 letter grade (off final grade), miss others -5 pts per miss (off presentation grade)
Presentations • Present Positive Image • Know your audience • Develop and follow a theme (no staple together) • Open – Body - Conclusion • Careful with humor • Watch mannerisms, posture • Test your AV gear
Presentations (cont’d) • Normally given by PM with support, but… • Backup slides • Rehearse – Stay within time limits • Leave room for questions • Be honest • Never read slides • Eye contact
Slides • Legibility (8x rule) • Images (relevant) • Avoid RANSOMnotes • Avoid mixed metaphors • Check details • Correct Spelling • Relevant/Correct Images • Correct Charts
OR • The 10/20/30 rule • No more than 10 slides • No more than 20 minutes • No less than 30 pt fonts.
Midterm Presentation Content(Status and Design) • Introduction of team • Team name, customer, faculty advisor, team members, their roles • Product to be delivered • Customer background, product context, tangible product to be developed • Overview of requirements • Design Alternatives, Design Selected, Rationale • Project plan • Project Backlog • Iteration 1 Backlog • Status • Iteration 1 Demo
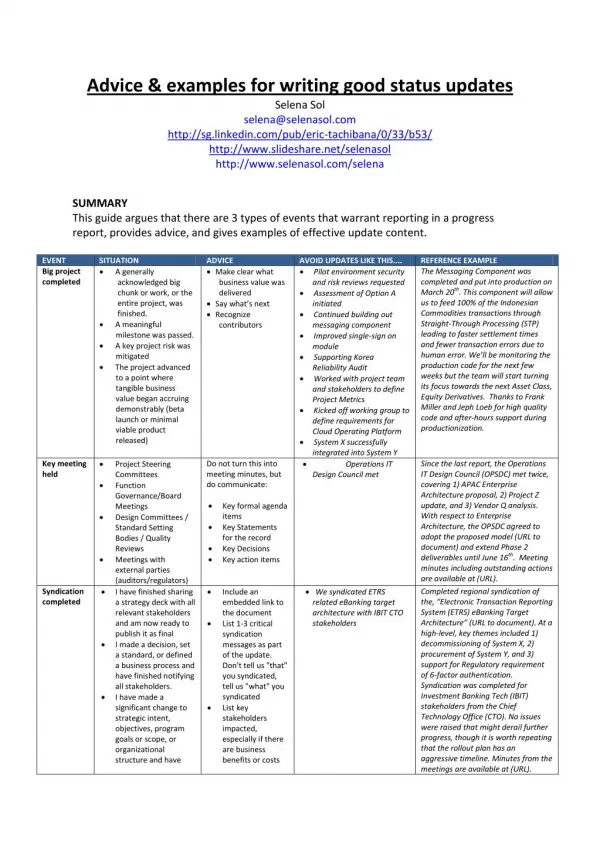
A Status Report shows: • Overview of project • Planned vs. work to go (Burn Down Charts) • Other Relevant Metrics • Major Milestones Met or Missed (Burndown) • Issues • “Show Stoppers” • It is NOT a “what I did on my summer project” save that for the final presentation!
The Project Manager’s Cube Quality Schedule Feature Set Resources
Schedule (Total) .02 to .03 Development • Planned • Actual • Projected As of 1/15/2004 Total Project Current Quarter Hours Expended
Schedule (By Major Activity) Design Coding Unit Test Integration As of 1/3/04
Resources (Person-Hours) Cumulative Effort (Person Hours) Time Projected Total Project Quarter Actual
Product Burndown charts Hours To Go 1 2 3 4 5 Sprint
Sprint Burndown Charts Hours To Go 1 2 3 4 5 Weeks
Resources (Expenditures) Cumulative Expenditures (Dollars) Planned Actual Time
Expenditure by Category Salary (Base) Overtime Equipment Travel Training Supplies Dollars ($)
Features 100 Planned Actual Percent Complete Security DB Design Reports Feature Item
Defect Rate Historical Actual Defects/KLOC Time
Issues • Excessive Overtime Rate • Design Element 1.3 Modification • Expansion of Requirements by 25% These should be things that are affecting your project: $, time, hours
Showstoppers • Issue: Main Development Server Hardware failure • Action: RAID Controller on order, expected delivery 2/12/07 • Impact: DB Coding stopped for 2 weeks, Work shifted to v2 design
Final Presentation Content(Design and Product) • Introduction of team • Team name, customer, faculty advisor, team members, their roles • Product to be delivered • Customer background, product context, tangible product to be developed, main design question(s) • Overview of requirements • Product actually delivered • Differences from plan; reasons; design resolution • Process strengths and weaknesses • Final Design • Demo (Iteration 3)
Demo at your Final Presentation • Your final presentation should include a demo of your product executing • Script it • Know exactly what you are going to show; practice demo • Have canned data available (not actual proprietary/personal data) • Don’t let demo be first time you try a feature • Be sure your demo runs in the presentation environment
Presentation Conclusions • Plan Presentation Sequence • Practice (maybe in front of mirror) • Check content • Relax and be confident
Design Reviews • Should follow on-line checklist • Conducted at each major iteration design • For this class—Review with instructor at Iteration 2 will focus on VALIDATION section. • Will post on Syllabus, so keep watching • Let me know of restrictions • (A Section Only) Can also do on Tuesdays 10-1500